
Browsing Category
Forex
5630 posts
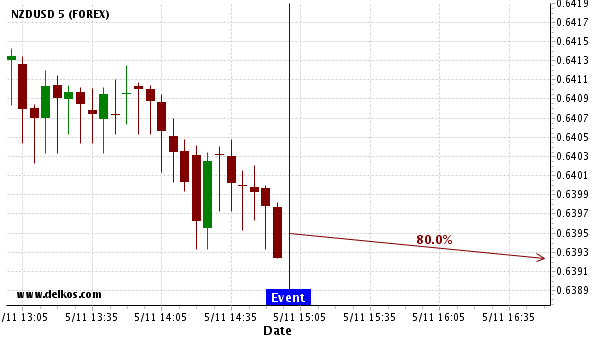
We expect NZDUSD to trend downwards with a 80% chance.
Based on the last 12 ISM Non-Manufacturing PMI events in United States, we expect NZDUSD to trend downwards.…
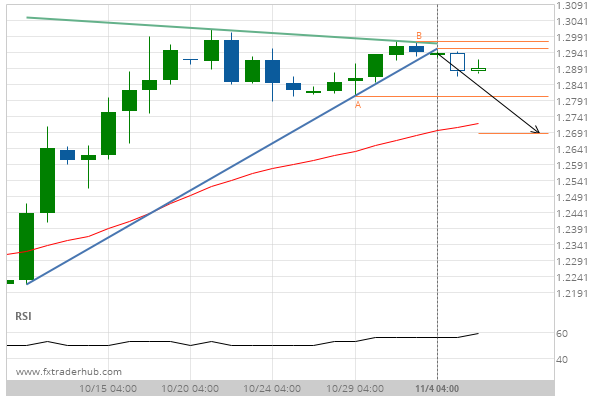
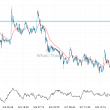
Breach of support could mean a start of a bearish trend on GBP/USD
GBP/USD has broken through a support line of a Triangle chart pattern. If this breakout holds true, we…
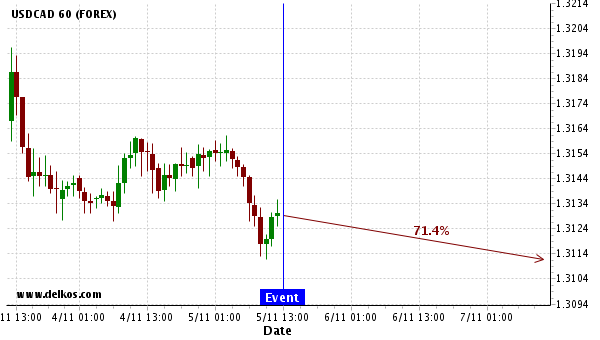
There is a 71.43% chance of USDCAD trending downwards
Based on past Canada Balance of Trade news events there is a 71.43% chance of USDCAD trending downwards.…
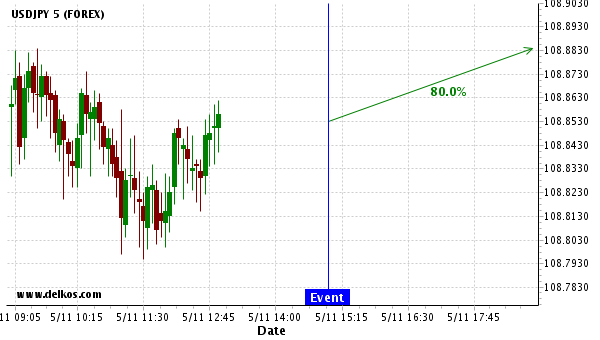
We expect USDJPY to trend upwards today with a 80% chance.
Based on the last 12 ISM Non-Manufacturing PMI events in United States, we expect USDJPY to trend upwards…
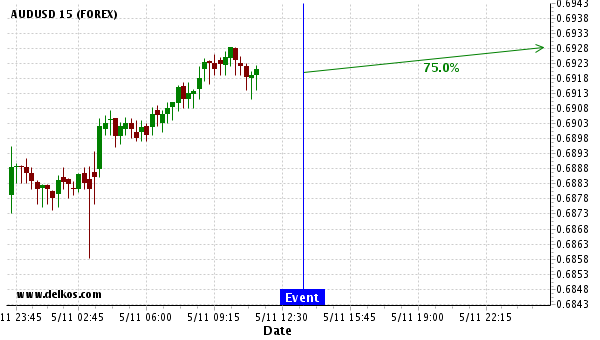
We expect a 18 pip movement on AUDUSD within 12 hours following the event release.
Based on the last 12 Balance of Trade events in United States, we expect a 18 pip movement…
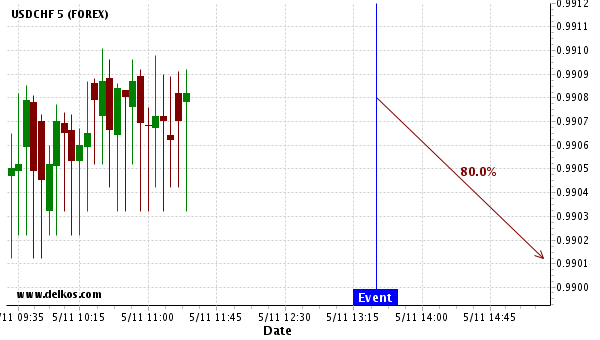
We expect a 11 pip movement on USDCHF within 2 hours following the event release.
Based on the last 12 Balance of Trade events in Canada, we expect a 11 pip movement on…
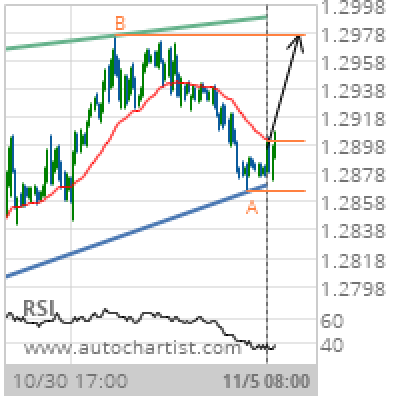
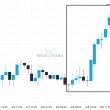
GBP/USD Target Level: 1.2976
Rising Wedge identified at 05-Nov-2019 08:00 UTC. This pattern is still in the process of forming. Possible bullish price movement towards the resistance 1.2976 within the next 3 days. Supported by RSI below 40 Chart 1 hourPattern Rising WedgeLength 191 CandlesIdentified 05-Nov-2019 08:00 UTC
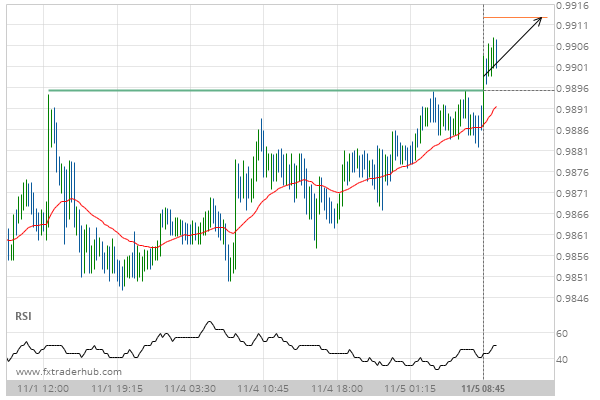
After testing 0.9896 numerous times, USD/CHF has finally broken through. Can we expect a bullish trend to follow?
The breakout of USD/CHF through the 0.9896 price line is a breach of an important psychological price that…
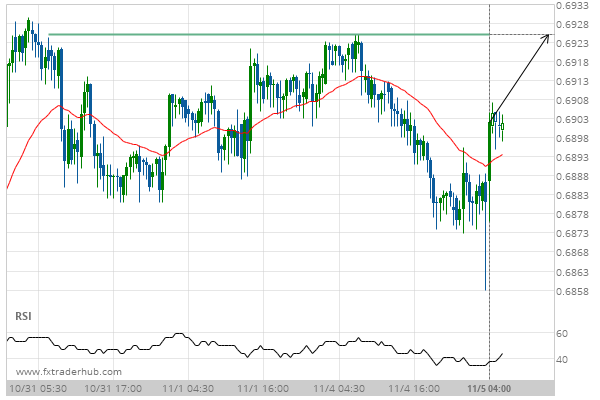
After testing 0.6925 numerous times, AUD/USD is once again approaching this price point. Can we expect a bullish trend to follow?
The movement of AUD/USD towards 0.6925 price line is yet another test of the line it reached numerous…
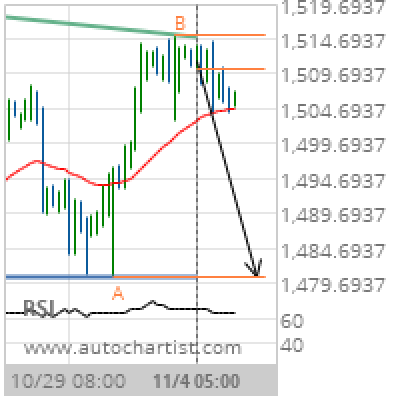
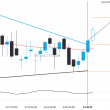
XAU/USD Target Level: 1480.6000
Descending Triangle identified at 04-Nov-2019 05:00 UTC. This pattern is still in the process of forming. Possible bearish price movement towards the support 1480.6000 within the next 2 days. Supported by RSI above 60 Chart 4 hourPattern Descending TriangleLength 60 CandlesIdentified 04-Nov-2019 05:00 UTC