
Browsing Category
Global Indices
6913 posts
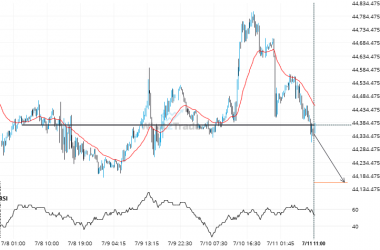
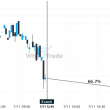
After trying numerous times in the past, DOW 30 finally breaks 44374.6914!
DOW 30 is once again retesting a key horizontal support level at 44374.6914. It has tested this level…
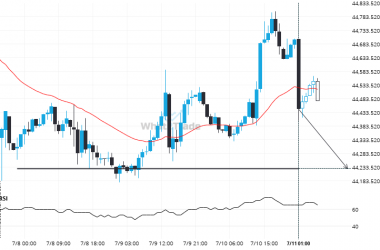
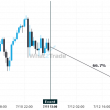
After testing 44227.1914 numerous times, DOW 30 is once again approaching this price point. Can we expect a bearish trend to follow?
The movement of DOW 30 towards 44227.1914 price line is yet another test of the line it reached…
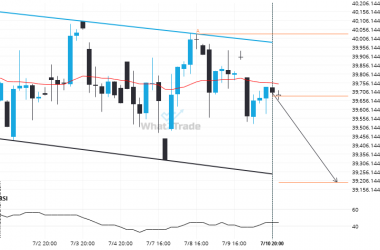
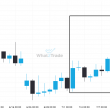
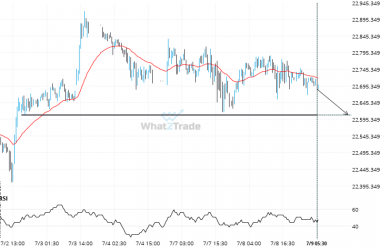
Nikkei 225 formed a Channel Down on the 4 hour chart. Retest of support in sight.
An emerging Channel Down has been detected on Nikkei 225 on the 4 hour chart. There is a…
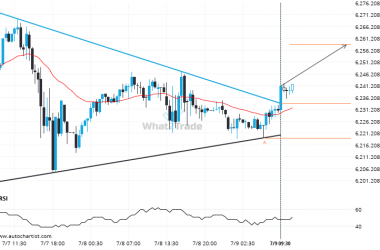
US 500 is approaching 6277.8501. We expect either a breakout through this line, or a rebound.
US 500 is en route to a very important line that will be a definite deciding factor of…
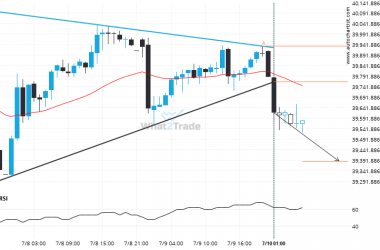
A possible move by Nikkei 225 towards 39385.2769
The last 3 1 hour candles on Nikkei 225 formed a Triangle pattern and broken out through the…
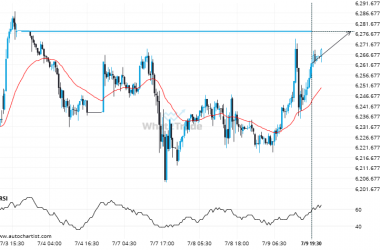
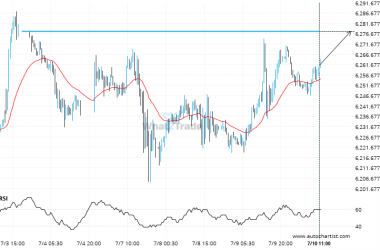
US 500 keeps moving closer towards 6277.8501. Will it finally breach this level?
US 500 is heading towards a line of 6277.8501. If this movement continues, the price of US 500…
After testing resistance twice in the past, US 500 has finally broken through. Can we expect a bullish trend to follow?
You would be well advised to confirm the breakout that has just occurred – do you believe the…
NAS 100 seems to be on its way to support – a possible opportunity?
NAS 100 is moving towards a key support level at 22608.2832. NAS 100 has previously tested this level…
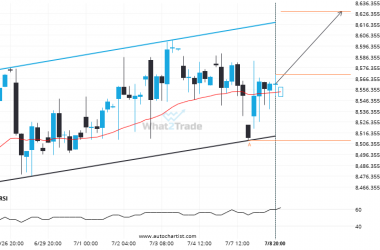
ASX 200 is approaching a resistance line of a Channel Up. It has touched this line numerous times in the last 14 days.
ASX 200 is moving towards a resistance line. Because we have seen it retrace from this line before,…
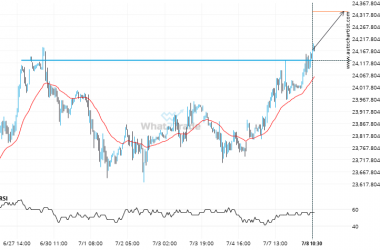
If you’re short DAX 40 you should be aware that 24129.0000 has just been breached – a level tested 3 time in the past
DAX 40 has broken through a resistance line. It has touched this line numerous times in the last…