
Browsing Category
US Stocks
6464 posts
Important support line being approached by NFLX. This price has been tested numerous time in the last 8 days
The movement of NFLX towards the support line of a Falling Wedge is yet another test of the…
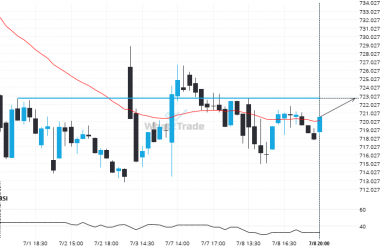
META is quickly approaching a very important level it has previously tested numerous times in the past
META is moving towards a key resistance level at 722.7450. META has previously tested this level 3 times…
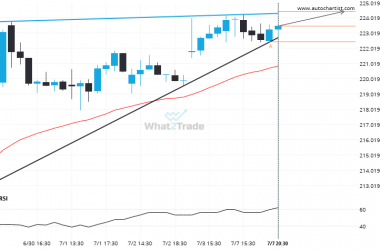
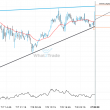
Because AMZN formed a Rising Wedge pattern, we expect it to touch the resistance line. If it breaks through resistance it may move much higher
AMZN is trapped in a Rising Wedge formation, implying that a breakout is Imminent. This is a great…
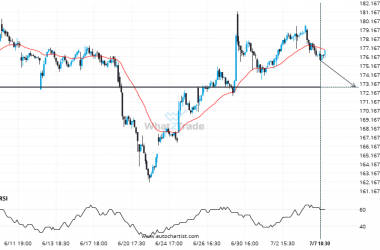
GOOGL keeps moving closer towards 172.7550. Will it finally breach this level?
GOOGL is moving towards a support line. Because we have seen it retrace from this level in the…
MSFT is signaling a possible trend reversal on the intraday charts with price not breaching support.
MSFT is moving towards a resistance line which it has tested numerous times in the past. We have…
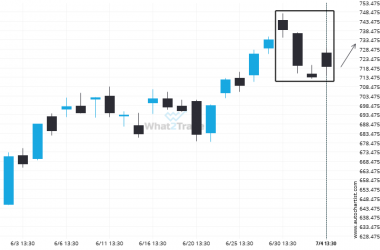
META experienced 4 consecutive daily bearish candles to reach a price of 718.9050
For those of you that don’t believe in trends, this may be an opportunity to take advantage of…
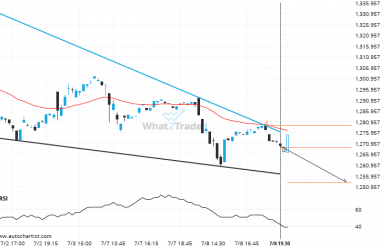
Important price line being approached by NFLX. This price has been tested numerous times before.
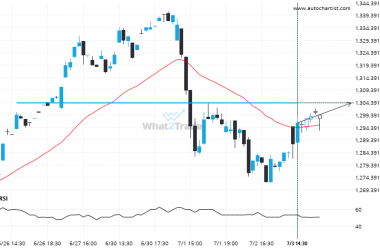
NFLX is heading towards 1304.2400 and could reach this point within the next 5 hours. It has tested…

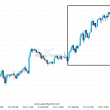
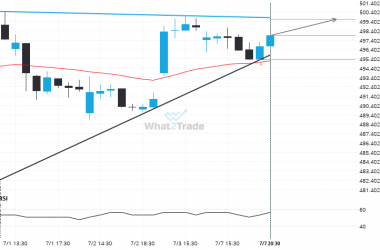
After testing resistance twice in the past, AMZN has finally broken through. Can we expect a bullish trend to follow?
The last 9 1 hour candles on AMZN formed a Triangle pattern and broken out through the pattern…
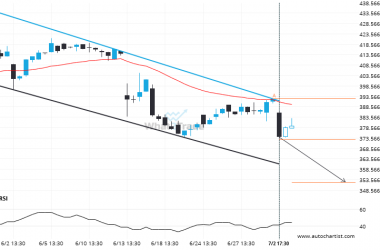
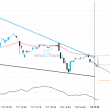
ADBE formed a Channel Down on the 4 hour chart. Retest of support in sight.
The movement of ADBE towards the support line of a Channel Down is yet another test of the…
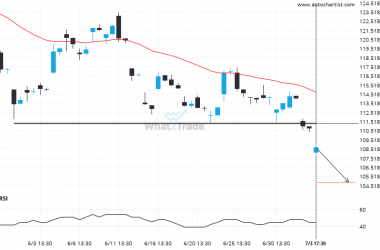
After trying numerous times in the past, BABA finally breaks 111.2700!
BABA has broken through a line of 111.2700. If this breakout holds true, we could see the price…