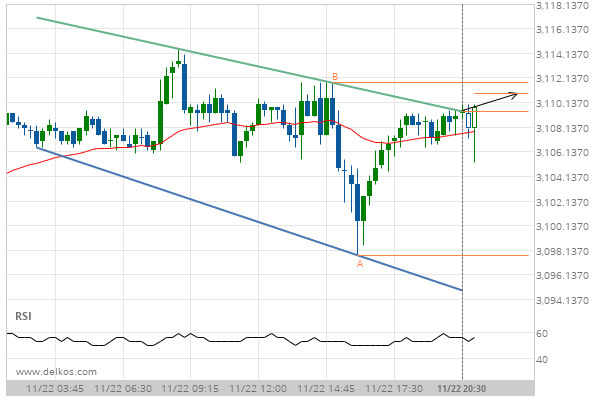
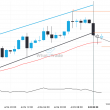
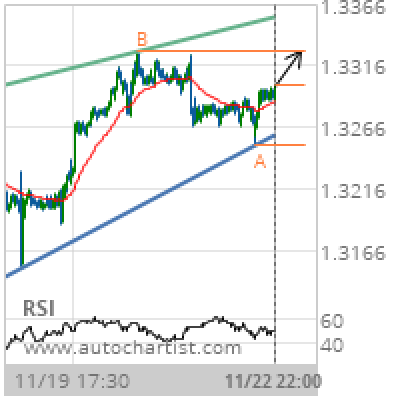

Rising Wedge identified at 22-Nov-2019 22:00 UTC. This pattern is still in the process of forming. Possible bullish price movement towards the resistance 1.3327 within the next 2 days. Supported by Upward sloping Moving Average
Chart 30 Minutes
Pattern Rising Wedge
Length 342 Candles
Identified 22-Nov-2019 22:00 UTC