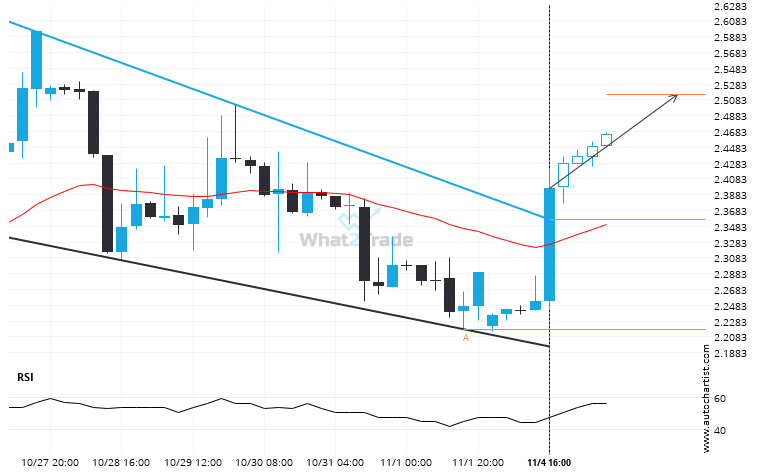
Natural Gas has broken through the resistance line which it has tested twice in the past. We have seen it retrace from this line before, so one should wait for confirmation of the breakout before trading. If this new trend persists, a target level of around 2.5154 may materialize within the next 2 days.
ARTÍCULOS RELACIONADOS
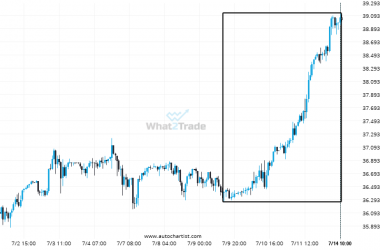
Silver Spot experienced a very large 5 days bullish move to 39.062.
Silver Spot has moved higher by 7.3% from 36.406 to 39.062 in the last 5 days.
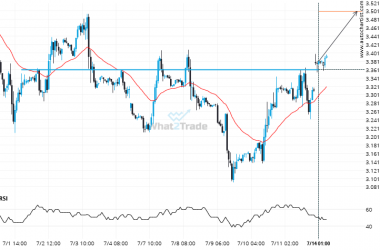
After testing 3.3610 numerous times, Natural Gas has finally broken through. Can we expect a bullish trend to follow?
Natural Gas has broken through 3.3610 which it has tested numerous times in the past. We have seen…
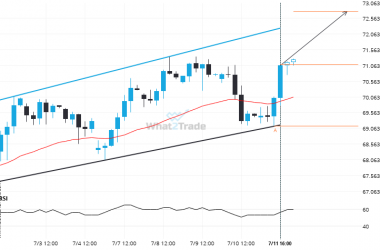
Because Brent Crude formed a Channel Up pattern, we expect it to touch the resistance line. If it breaks through resistance it may move much higher
Brent Crude is approaching the resistance line of a Channel Up. It has touched this line numerous times…

