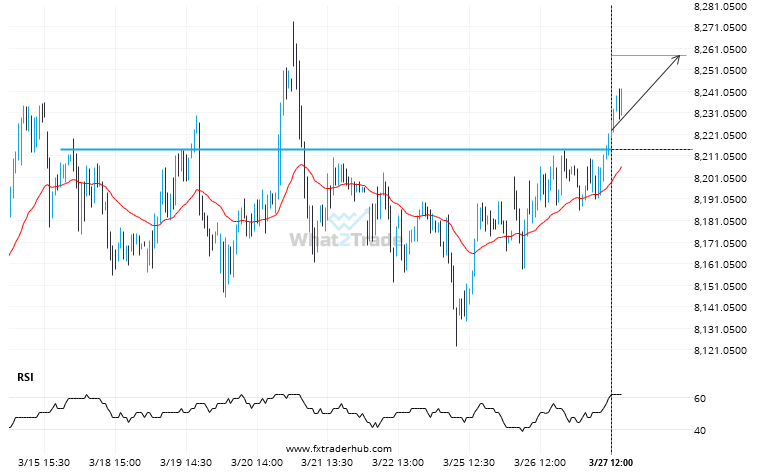
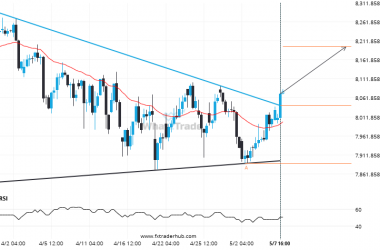
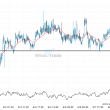
FRA40 has broken through a resistance line. It has touched this line numerous times in the last 12 days. This breakout shows a potential move to 8257.6504 within the next 2 days. Because we have seen it retrace from this level in the past, one should wait for confirmation of the breakout.
ARTÍCULOS RELACIONADOS
Extreme movement experienced on UK100. Check this chart to see what to do next
A movement of 6.41% over 20 days on UK100 doesn’t go unnoticed. You may start considering where it’s…
Bulls aim for 8197.1608 after the FRA40 triggered a bullish formation on the 4 hour chart
FRA40 has broken through a resistance line of a Triangle chart pattern. If this breakout holds true, we…
AUS200 hits 7763.0 after a 1.74% move spanning 4 days
AUS200 hits 7763.0 after a 1.74% move spanning 4 days.