
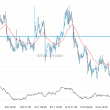
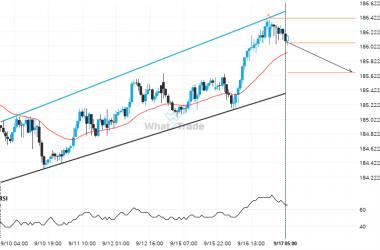
AUD/USD has broken through the support line of a Triangle technical chart pattern. Because we have seen it retrace from this line in the past, one should wait for confirmation of the breakout before taking any action. It has touched this line twice in the last 16 days and suggests a possible target level to be around 0.7212 within the next 4 days.
ARTÍCULOS RELACIONADOS
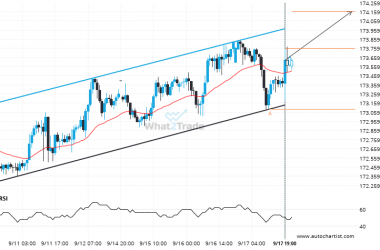
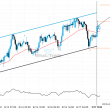
EURJPY is approaching a resistance line of a Channel Up. It has touched this line numerous times in the last 8 days.
Emerging Channel Up pattern in its final wave was identified on the EURJPY 1 hour chart. After a…
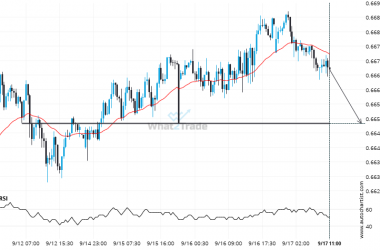
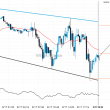
After testing 0.6651 numerous times, AUDUSD is once again approaching this price point. Can we expect a bearish trend to follow?
AUDUSD is heading towards 0.6651 and could reach this point within the next 19 hours. It has tested…
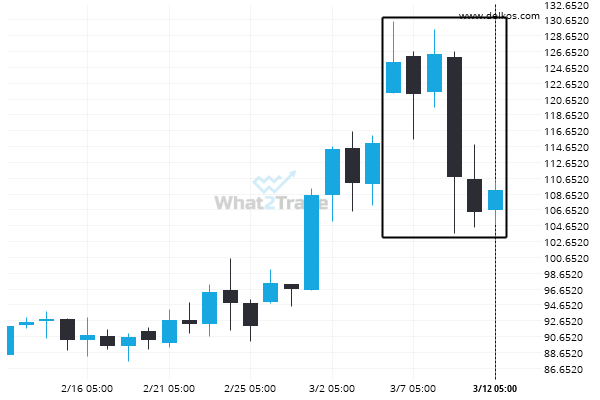
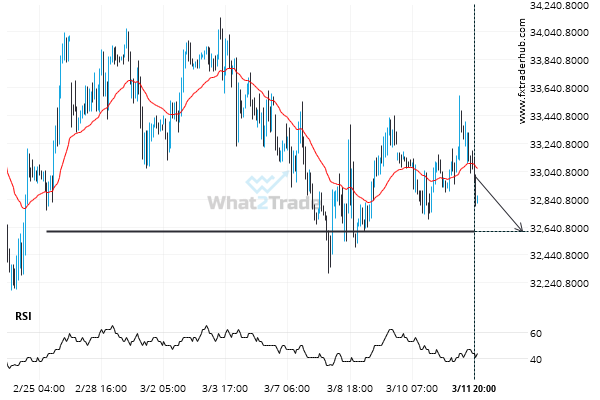
A possible move on CHFJPY as it heads towards support
CHFJPY is moving towards a support line. Because we have seen it retrace from this line before, we…