
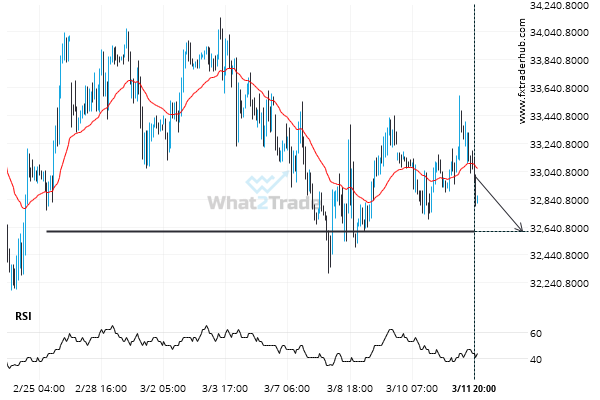
AUD/USD has broken through the support line of a Triangle technical chart pattern. Because we have seen it retrace from this line in the past, one should wait for confirmation of the breakout before taking any action. It has touched this line twice in the last 16 days and suggests a possible target level to be around 0.7212 within the next 4 days.
Related Posts
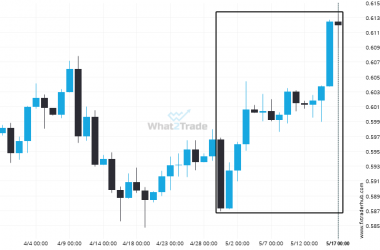
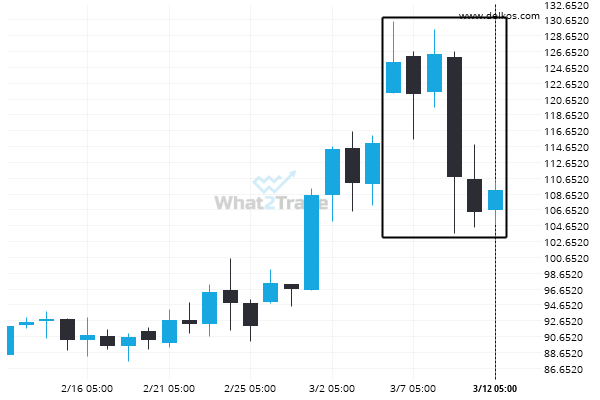
Is the extremely large movement on NZD/USD a sign of things to come?
NZD/USD has moved higher by 4.19% from 0.58776 to 0.61239 in the last 18 days.
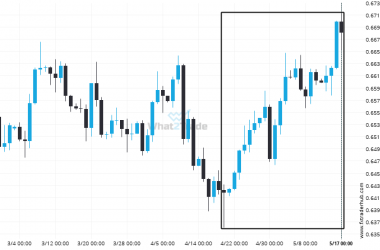
An unexpected large move has occurred on AUD/USD Daily chart! Is this a sign of something new? What can we expect?
AUD/USD has experienced an exceptionally large movement higher by 4.1% from 0.64192 to 0.66822 in the last 29…
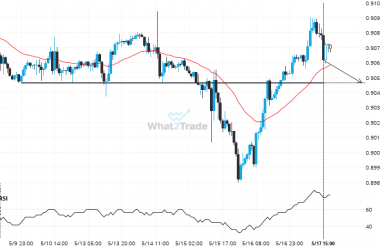
A final push possible on USD/CHF as it starts approaching a price line of 0.9055.
USD/CHF is moving towards a key support level at 0.9055. USD/CHF has previously tested this level 5 times…