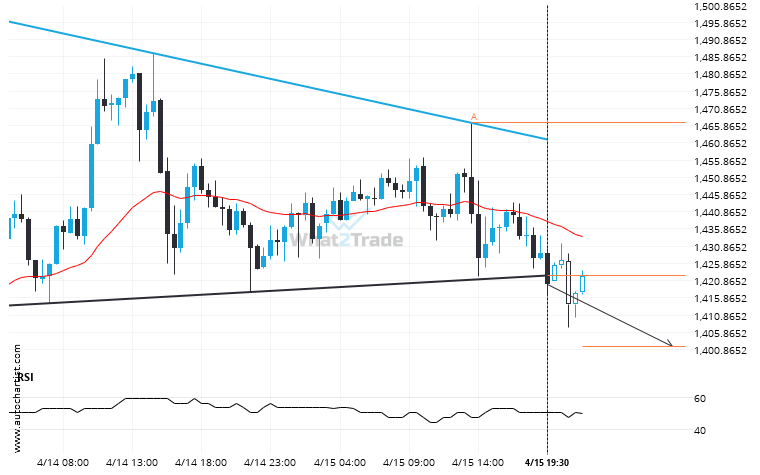
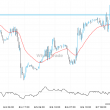
ETHEUR moved through the support line of a Triangle at 1422.4331034482757 on the 30 Minutes chart. This line has been tested a number of times in the past and this breakout could mean an upcoming change from the current trend. It may continue in its current direction toward 1401.6907.
ARTÍCULOS RELACIONADOS
After experiencing a 20.64% bearish move in the space of 36 days, nobody knows where ETHBTC is headed.
An unexpected large move has occurred on ETHBTC Daily chart beginning at 0.02369 and ending at 0.0188. Is…
If you’re short ADAUSD you should be aware of the rapidly approaching level of 0.7018
ADAUSD is moving towards a line of 0.7018 which it has tested numerous times in the past. We…
A Channel Up has formed, LTCUSD is approaching resistance. Can we expect a breakout and the start of a new trend or a reversal?
LTCUSD is trapped in a Channel Up formation, implying that a breakout is Imminent. This is a great…