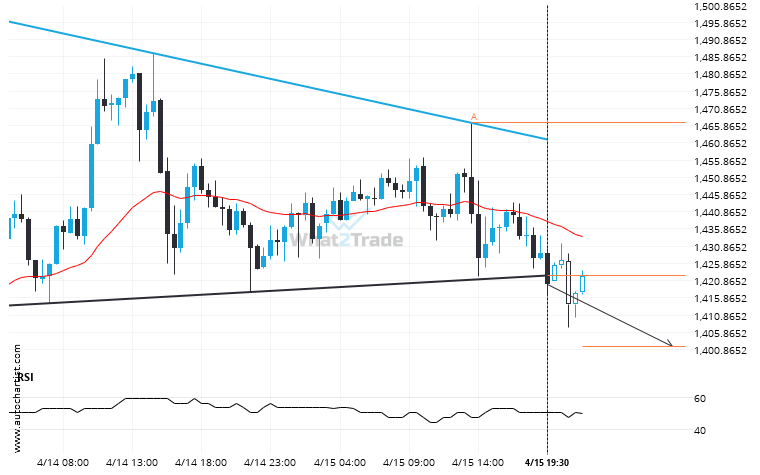
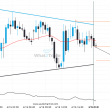
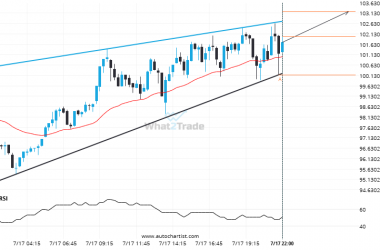
ETHEUR moved through the support line of a Triangle at 1422.4331034482757 on the 30 Minutes chart. This line has been tested a number of times in the past and this breakout could mean an upcoming change from the current trend. It may continue in its current direction toward 1401.6907.
Related Posts
XRPBTC consistently settling in one direction. Will it continue?
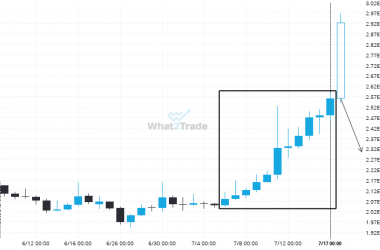
After posting 11 consecutive bullish candles in 12 days, you may start considering where XRPBTC is heading next,…
DASHBTC moves higher to 0.0001976 in the last 9 hours.
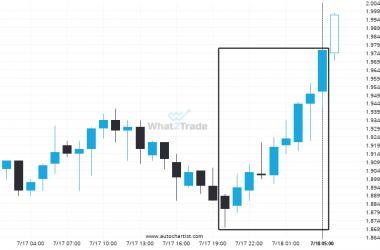
DASHBTC experienced an extremely large move that lasted 9. This movement is in the 99.0 percentile and is…
LTCUSD is approaching a resistance line of a Rising Wedge. It has touched this line numerous times in the last 2 days.
Emerging Rising Wedge detected on LTCUSD – the pattern is an emerging one and has not yet broken…

