
Day: October 24, 2019
39 posts
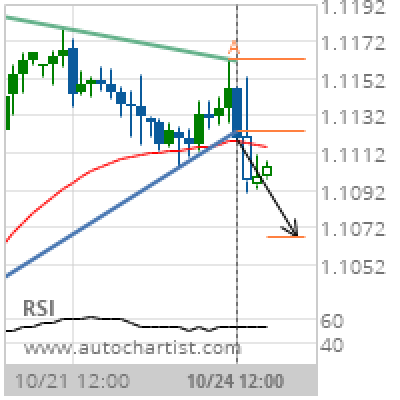
EUR/USD Target Level: 1.1067
Triangle has broken through the support line at 24-Oct-2019 12:00 UTC. Possible bearish price movement forecast for the next 2 days towards 1.1067. Supported by Downward sloping Moving Average Chart 4 hourPattern TriangleLength 41 CandlesIdentified 24-Oct-2019 12:00 UTC
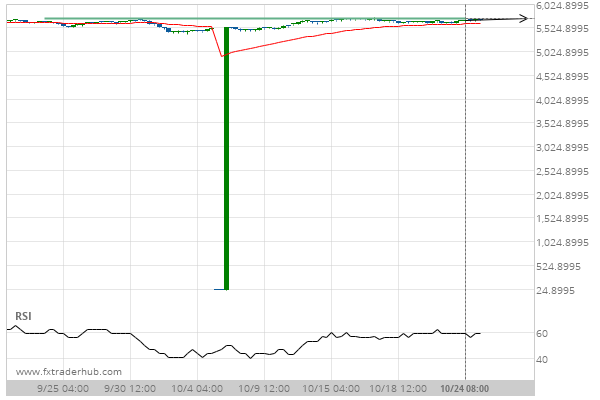
Support line breached by Light Sweet Crude Oil DECEMBER 2019. This price has been tested at least twice before.
Light Sweet Crude Oil DECEMBER 2019 has broken through the support line which it has tested twice in…
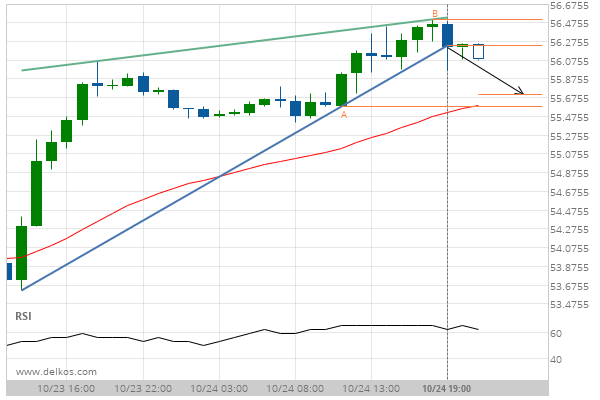
A final push expected on FRA40 as it starts approaching a price line of 5725.0000.
FRA40 is heading towards a price line of 5725.0000 and could reach this point within the next 4…
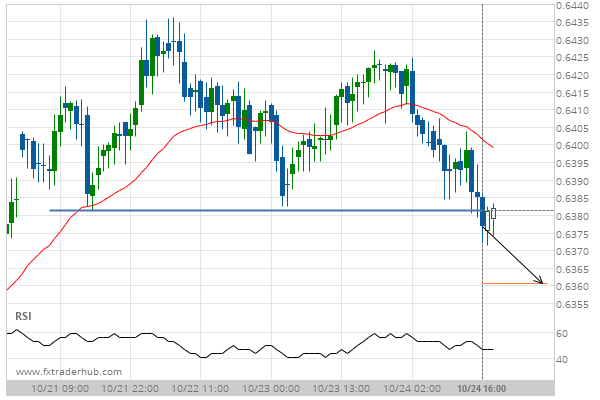
NZD/USD – breach of price line thats been previously tested numerous times before
NZD/USD has broken through the support line of a Support. Because we have seen it retrace from this…
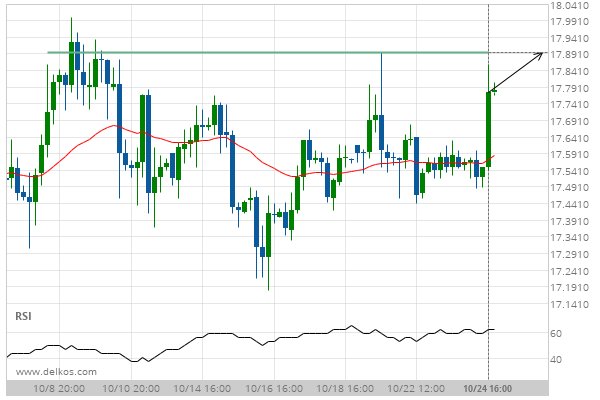
Silver DECEMBER 2019 is quickly approaching 17.8950. We expect either a breakout through this line, or a rebound.
Silver DECEMBER 2019 is heading towards a line of 17.8950. If this movement continues, we expect the price…
Breach of resistance could mean a start of a bullish trend on ETHCAD
ETHCAD has broken through a resistance line of a Triangle chart pattern. If this breakout holds true, we…
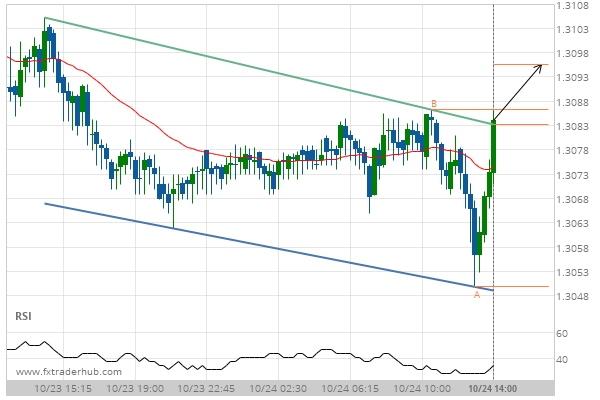
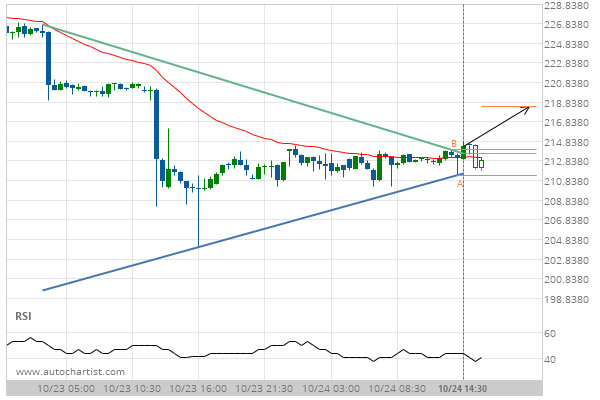
Big movement expected on USD/CAD after a breach of the resistance
USD/CAD has broken through a resistance line of a Channel Down and suggests a possible movement to 1.3096…
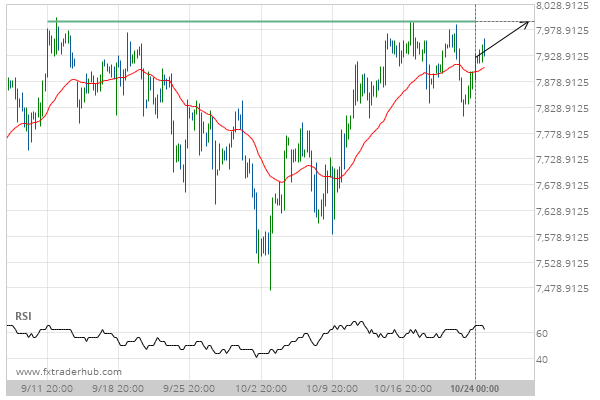
NAS100 is quickly approaching 7994.7500. We expect either a breakout through this line, or a rebound.
NAS100 is heading towards a line of 7994.7500. If this movement continues, we expect the price of NAS100…
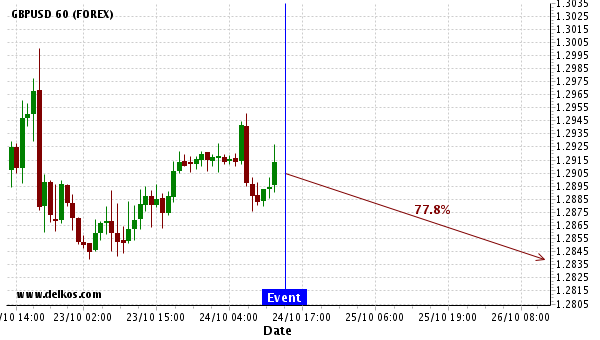
We expect a $790 movement on GBPUSD within 48 hours following the release of New Home Sales.
Historical events that allowed us to draw this conclusion 25 Sep 14:00 24 Jul 14:00 23 Apr 14:00…
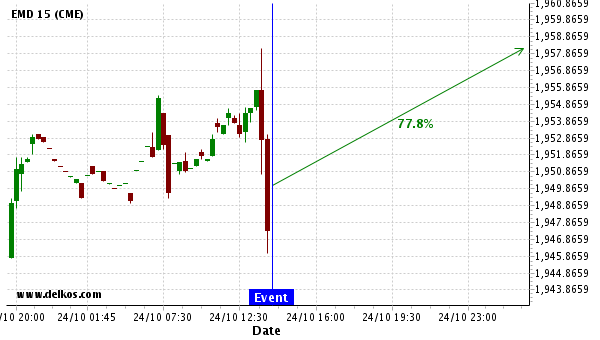
We expect EMD to trend upwards with a 77.78% chance.
Historical events that allowed us to draw this conclusion 25 Sep 14:00 24 Jul 14:00 23 Apr 14:00…