

Day: October 7, 2019
18 posts
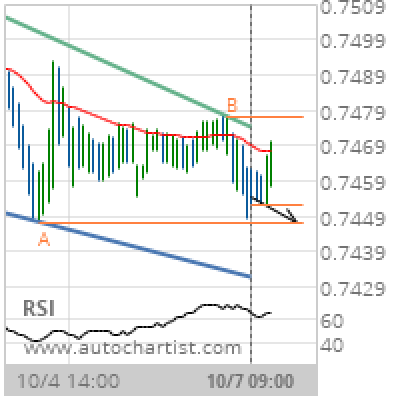
CAD/CHF Target Level: 0.7447
Falling Wedge identified at 07-Oct-2019 09:00 UTC. This pattern is still in the process of forming. Possible bearish price movement towards the support 0.7447 within the next 12 hours. Supported by RSI above 60 Chart 30 MinutesPattern Falling WedgeLength 85 CandlesIdentified 07-Oct-2019 09:00 UTC
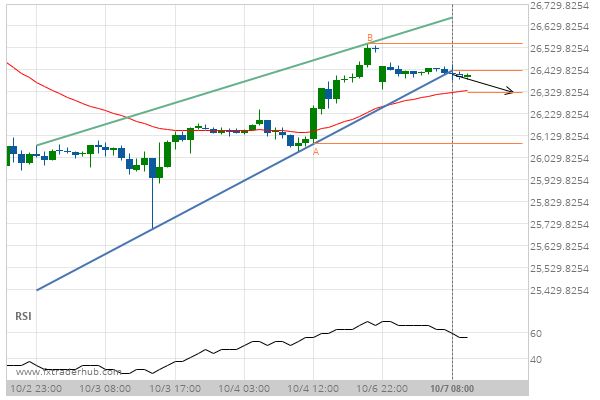
Breach of support could mean a start of a bearish trend on US30
US30 has broken through a support line of a Rising Wedge chart pattern. If this breakout holds true,…
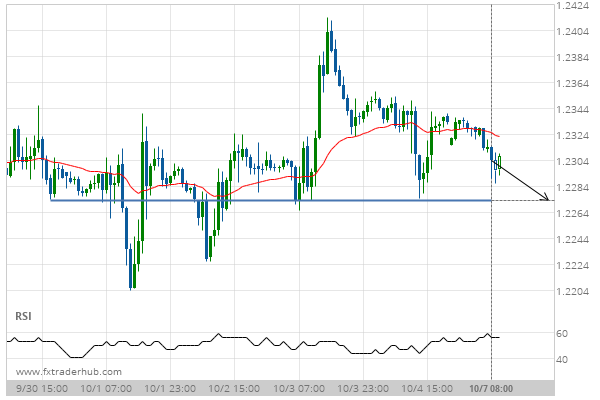
GBP/USD is quickly approaching 1.2273. We expect either a breakout through this line, or a rebound.
GBP/USD is heading towards a line of 1.2273. If this movement continues, we expect the price of GBP/USD…
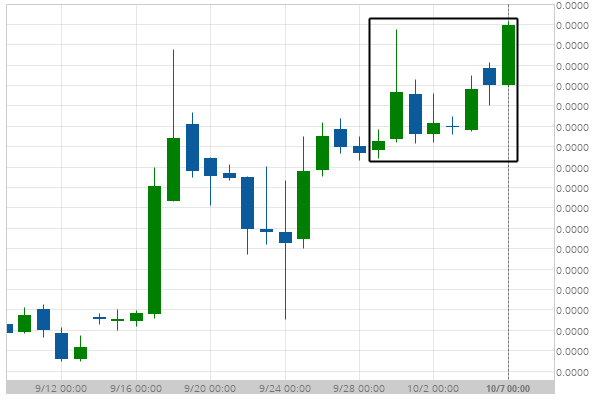
XRPBTC experienced a very large 9 days bullish move to 0
XRPBTC has moved higher by 9.99% from 0 to 0 in the last 9 days.
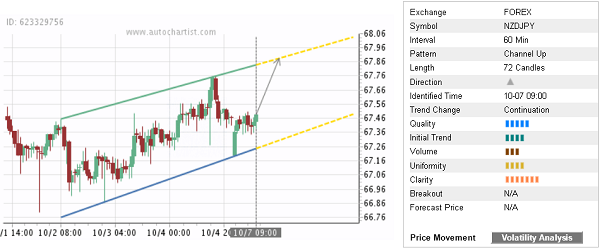
Trade of the Day: NZD/JPY
By: Dima Chernovolov NZD/JPY continues to rise inside the hourly Up Channel chart pattern which was identified recently by Autochartist. Autochartist rates the quality of this Up Channel at the 5-bar level – which reflects the below-average Initial Trend (4 bars), medium Uniformity (4 bars) and significant Clarity (7 bars). NZD/JPY is expected to rise…
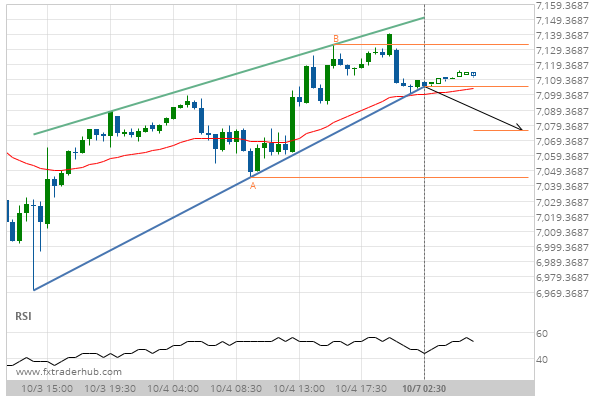
Breach of support could mean a start of a bearish trend on UK100
UK100 has broken through a support line of a Rising Wedge chart pattern. If this breakout holds true,…
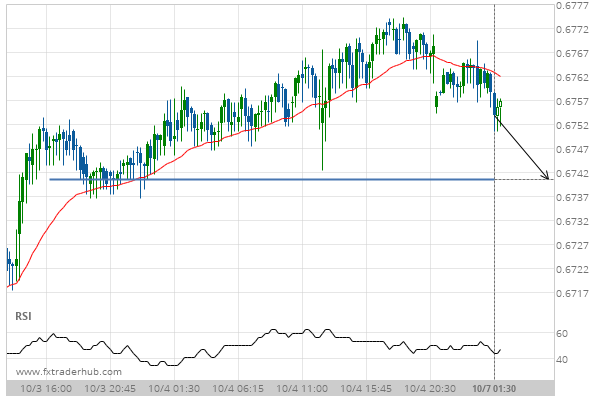
After testing 0.6740 numerous times, AUD/USD is once again approaching this price point. Can we expect a bearish trend to follow?
The movement of AUD/USD towards 0.6740 price line is yet another test of the line it reached numerous…
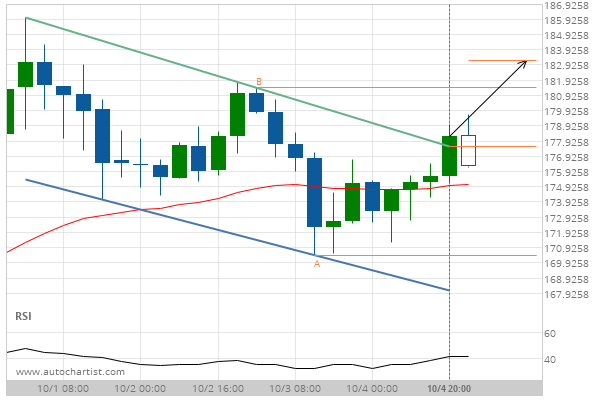
Big movement expected on ETHUSD after a breach of the resistance
ETHUSD has broken through a resistance line of a Flag and suggests a possible movement to 183.2242 within…