
Day: August 15, 2019
26 posts
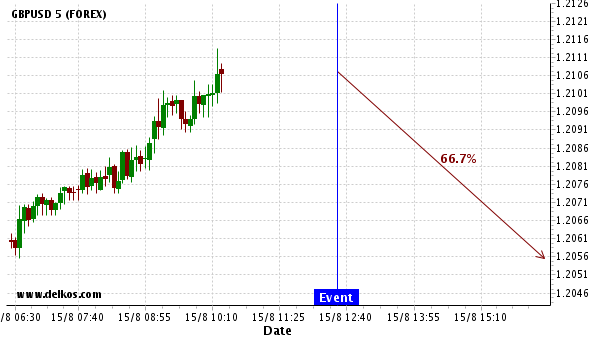
We expect GBPUSD to trend downwards right now.
Based on the last 12 Retail Sales MoM events in United States, we expect GBPUSD to trend downwards…
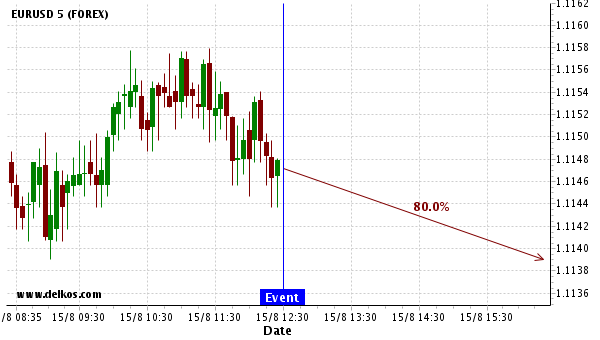
We expect EURUSD to trend downwards right now.
Based on the last 12 Continuing Jobless Claims events in United States, we expect EURUSD to trend downwards…
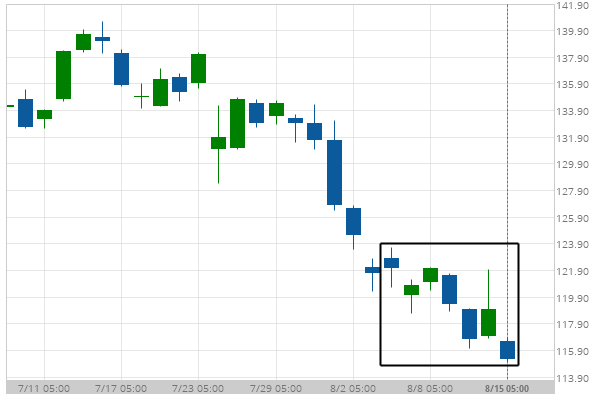
Caterpillar Inc. moves lower to 115.21 in the last 10 days.
A movement of 6.17% over 10 days on Caterpillar Inc. doesn’t go unnoticed. You may start considering where…
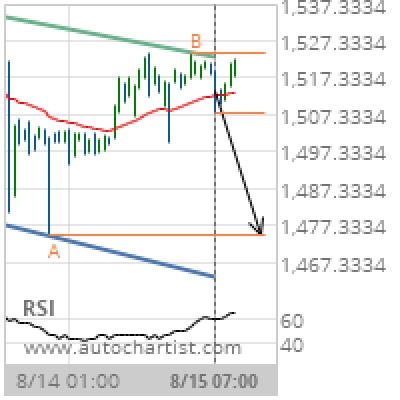
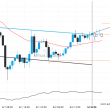
XAU/USD Target Level: 1474.7000
Channel Down identified at 15-Aug-2019 07:00 UTC. This pattern is still in the process of forming. Possible bearish price movement towards the support 1474.7000 within the next 19 hours. Supported by RSI above 60 Chart 1 hourPattern Channel DownLength 71 CandlesIdentified 15-Aug-2019 07:00 UTC
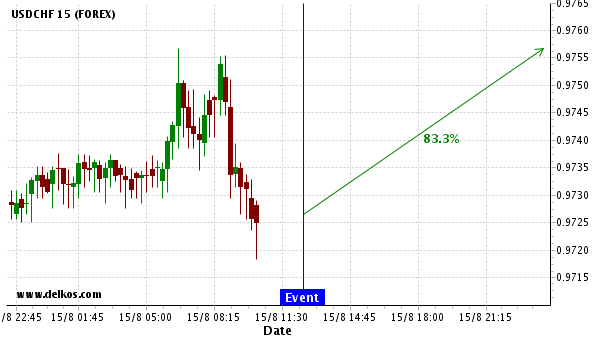
Be very careful of upcoming volatility. We expect a $215.893 movement on USDCHF.
Be very careful of upcoming volatility because of United States Retail Sales MoM news event later today. Based…
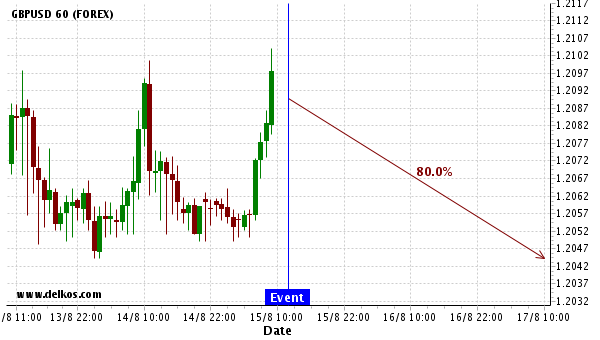
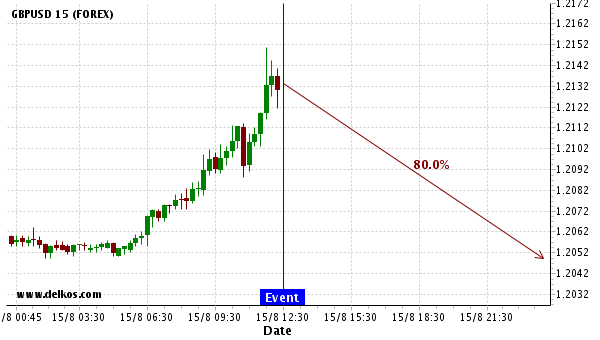
We expect GBPUSD to trend downwards today with a 80% chance.
Based on the last 12 Continuing Jobless Claims events in United States, we expect GBPUSD to trend downwards…
Be very careful of upcoming volatility. We expect a $520 movement on GBPUSD.
Be very careful of upcoming volatility because of United States Philadelphia Fed Manufacturing Index news event later today.…
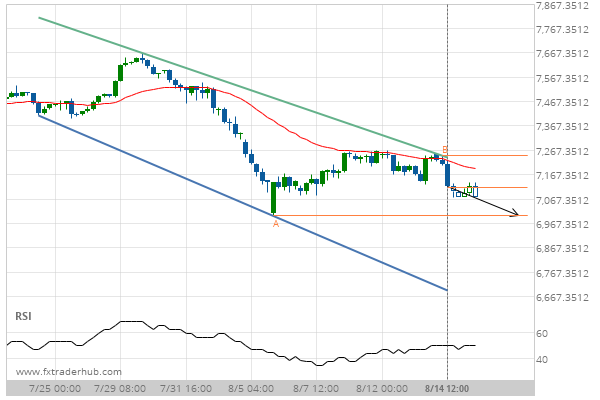
After testing the support line numerous times, UK100 is once again approaching this line. Can we expect a bearish trend to follow?
The movement of UK100 towards the support line of a Channel Down is yet another test of the…
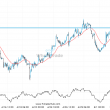
A quick move expected on BTCUSD as it starts approaching a resistance line of a Channel Down
BTCUSD is heading towards the resistance line of a Channel Down and could reach this point within the…
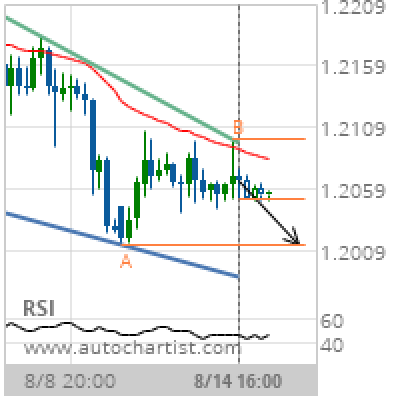
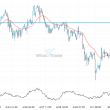
GBP/USD Target Level: 1.2014
Falling Wedge identified at 14-Aug-2019 16:00 UTC. This pattern is still in the process of forming. Possible bearish price movement towards the support 1.2014 within the next 2 days. Supported by Downward sloping Moving Average Chart 4 hourPattern Falling WedgeLength 56 CandlesIdentified 14-Aug-2019 16:00 UTC