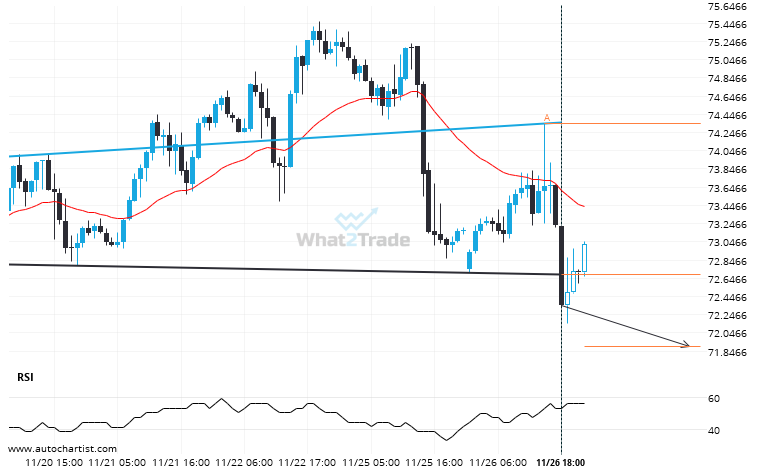
Brent Crude moved through the support line of a Head and Shoulders at 72.6865294117647 on the 1 hour chart. This line has been tested a number of times in the past and this breakout could mean an upcoming change from the current trend. It may continue in its current direction toward 71.8954.
Related Posts
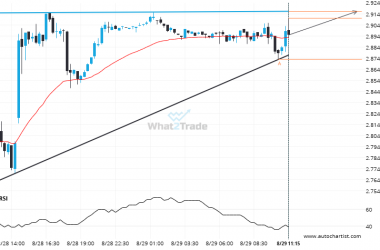
Natural Gas formed a Ascending Triangle on the 15 Minutes chart. Retest of resistance in sight.
Emerging Ascending Triangle detected on Natural Gas – the pattern is an emerging one and has not yet…
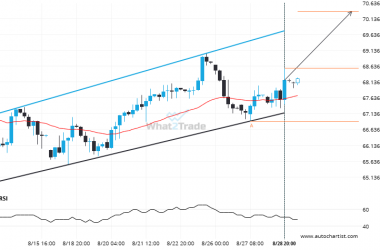
A Channel Up has formed, Brent Crude is approaching support. Can we expect a breakout and the start of a new trend or a reversal?
Brent Crude was identified at around 68.572 having recently rebounded of the support on the 4 hour data…
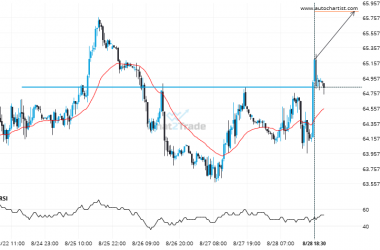
After trying numerous times in the past, US Oil finally breaks 64.8375!
The breakout of US Oil through the 64.8375 price line is a breach of an important psychological price…

