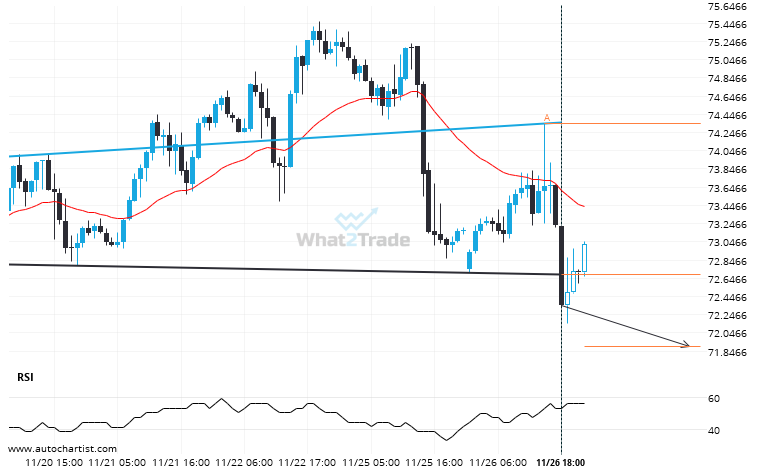
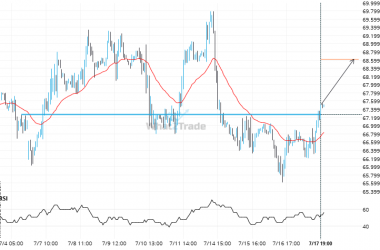
Brent Crude moved through the support line of a Head and Shoulders at 72.6865294117647 on the 1 hour chart. This line has been tested a number of times in the past and this breakout could mean an upcoming change from the current trend. It may continue in its current direction toward 71.8954.
Related Posts
After testing the support line numerous times, US Oil is once again approaching this line. Can we expect a bearish trend to follow?
US Oil is moving towards a support line. Because we have seen it retrace from this line before,…
Will Silver Spot break through the support level it tested before?
Silver Spot is approaching a support line at 35.7904. If it hits the support line, it may break…
A possible move by Natural Gas towards 3.4712
Pennant pattern identified on Natural Gas has broken through a resistance level with the price momentum continuing to…