Based on the last 12 Michigan Consumer Sentiment Prel events in United States, we could see…
Derniers messages
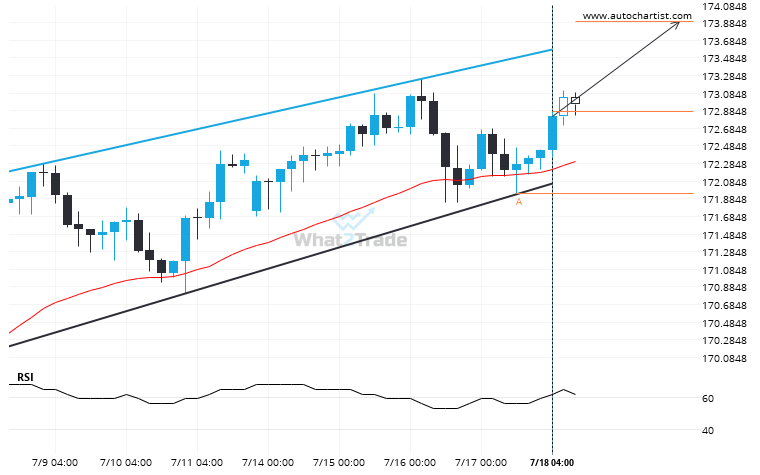
Important resistance line being approached by EURJPY. This price has been tested numerous time in the last 12 days
Emerging Channel Up detected on EURJPY – the pattern is an emerging one and has not…
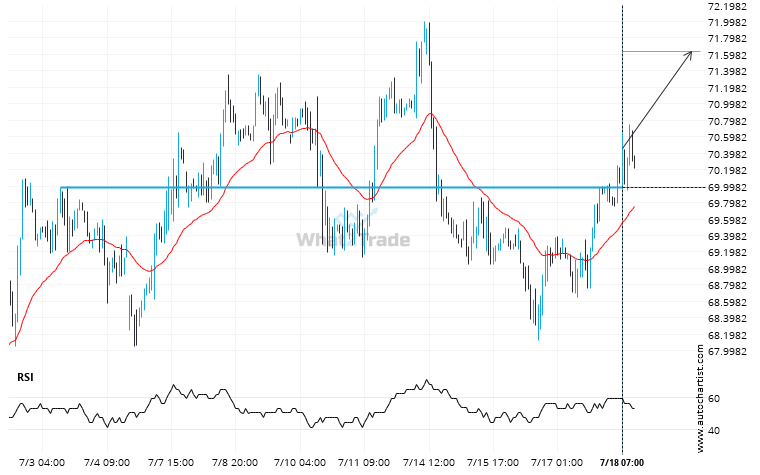
Important price line breached by Brent Crude. This price has been tested numerous times before.
Brent Crude has broken through 69.9835 which it has tested numerous times in the past. We…
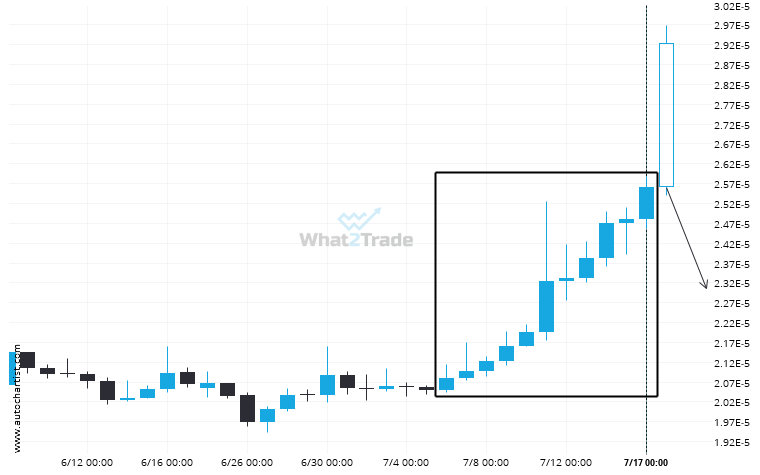
XRPBTC consistently settling in one direction. Will it continue?
After posting 11 consecutive bullish candles in 12 days, you may start considering where…
Prévisions des événements économiques
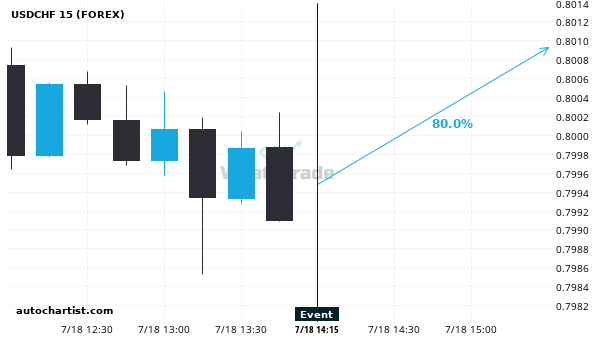
We expect USDCHF to trend upwards with a 80% chance.
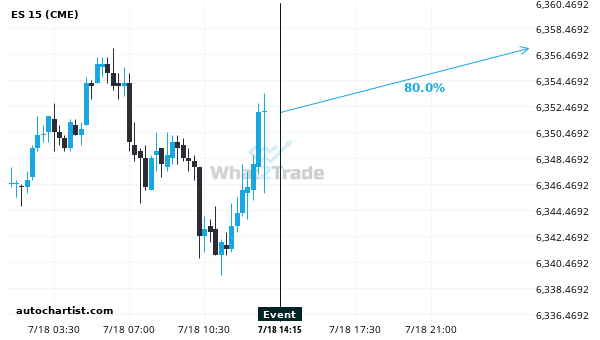
Based on the last 12 Michigan Consumer Sentiment Prel events in United States, we could see…
We expect a $446228 movement on ES within 12 hours following the release of Michigan Consumer Sentiment Prel.
Based on the last 12 Michigan Consumer Sentiment Prel events in United States, we expect ES…
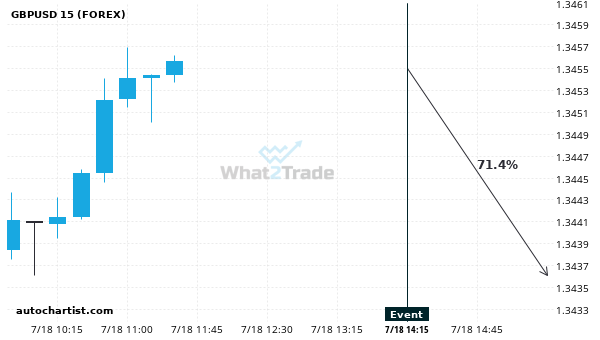
We expect a $590 movement on GBPUSD within 2 hours following the event release at 2025-07-18 14:00.
Based on the last 12 Michigan Consumer Sentiment Prel events in United States, we expect a…
Actions US
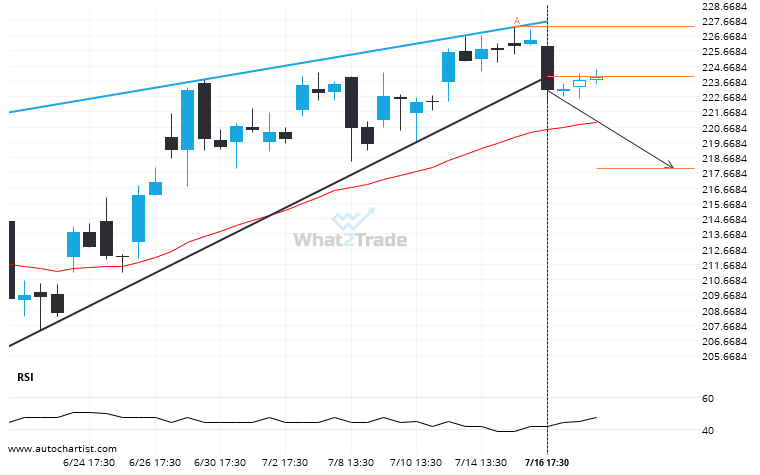
AMZN has broken through support of a Rising Wedge. It has touched this line at least twice in the last 31 days.
AMZN has broken through a support line of a Rising Wedge chart pattern. If this breakout…
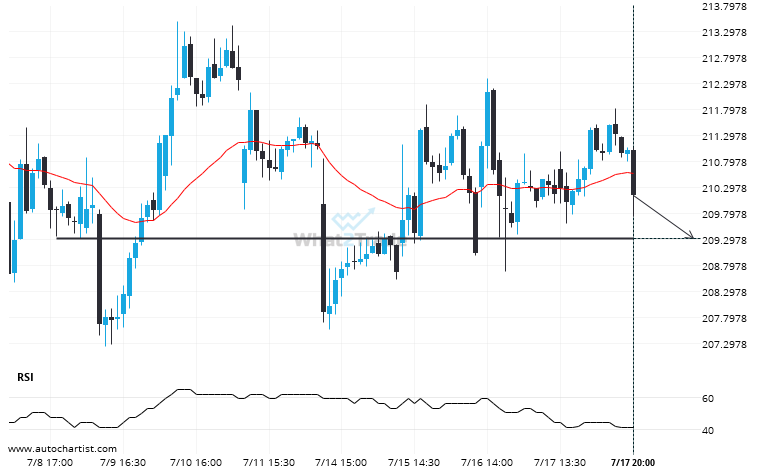
AAPL heading towards a price it has tested 5 times in the recent past.
AAPL is moving towards a line of 209.3100 which it has tested numerous times in the past. We…
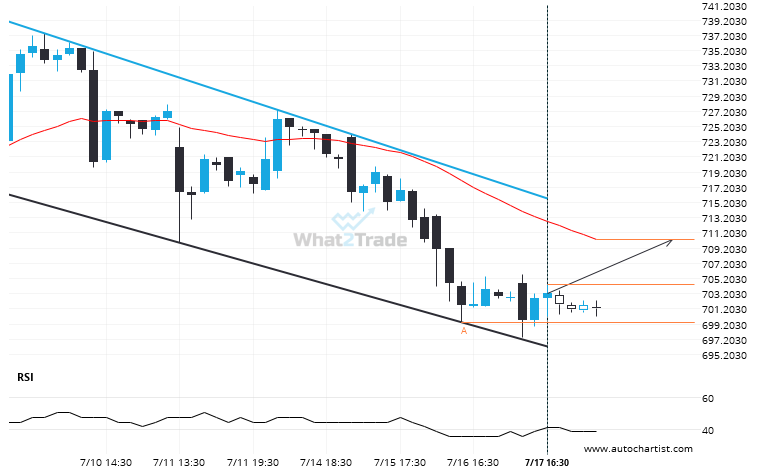
A Channel Down has formed, META is approaching support. Can we expect a breakout and the start of a new trend or a reversal?
META is moving towards a resistance line. Because we have seen it retrace from this line…
Crypto
XRPBTC consistently settling in one direction. Will it continue?
After posting 11 consecutive bullish candles in 12 days, you may start considering where…
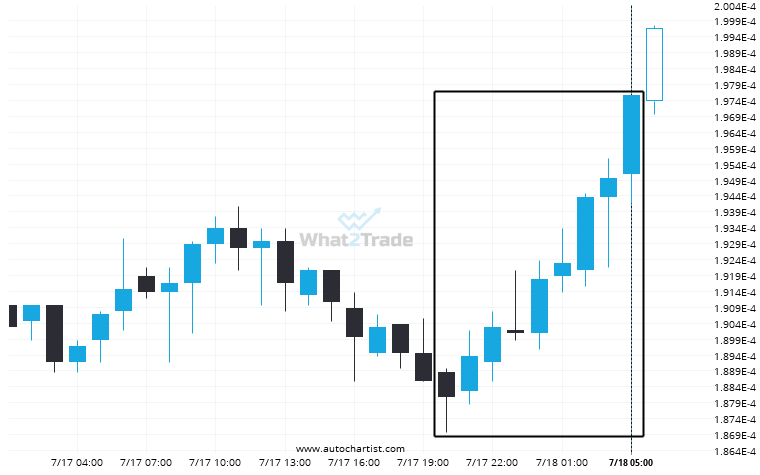
DASHBTC moves higher to 0.0001976 in the last 9 hours.
DASHBTC experienced an extremely large move that lasted 9. This movement is in the 99.0…
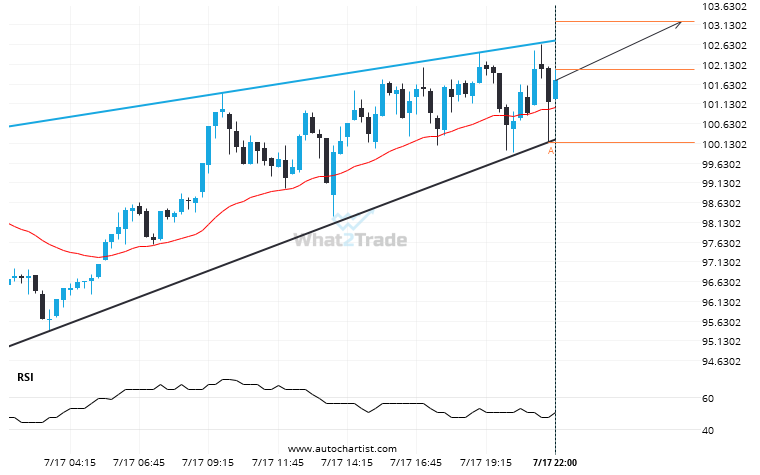
LTCUSD is approaching a resistance line of a Rising Wedge. It has touched this line numerous times in the last 2 days.
Emerging Rising Wedge detected on LTCUSD – the pattern is an emerging one and has not…
Forex
Important resistance line being approached by EURJPY. This price has been tested numerous time in the last 12 days
Emerging Channel Up detected on EURJPY – the pattern is an emerging one and has not…
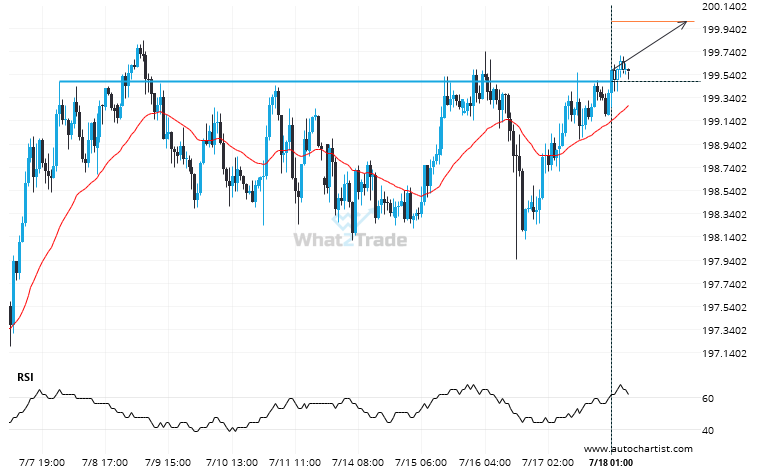
GBPJPY has broken through a level it has tested 5 times in the recent past.
GBPJPY is once again retesting a key horizontal resistance level at 199.4810. It has tested…
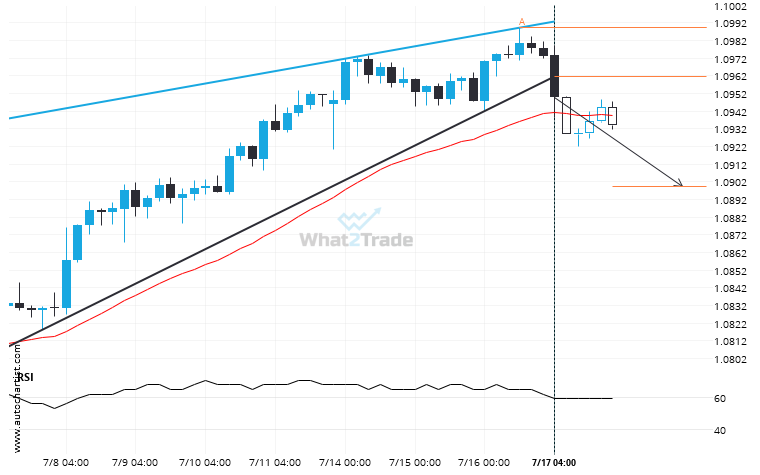
Breach of support could mean a start of a bearish trend on AUDNZD
Rising Wedge pattern identified on AUDNZD has broken through a support level with the price…
Indices mondiaux
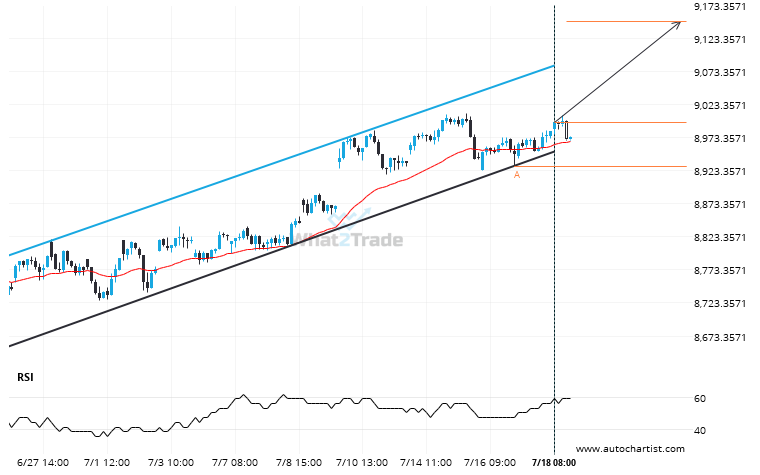
After testing the resistance line numerous times, FTSE 100 is once again approaching this line. Can we expect a bullish trend to follow?
The movement of FTSE 100 towards the resistance line of a Channel Up is yet another test of…
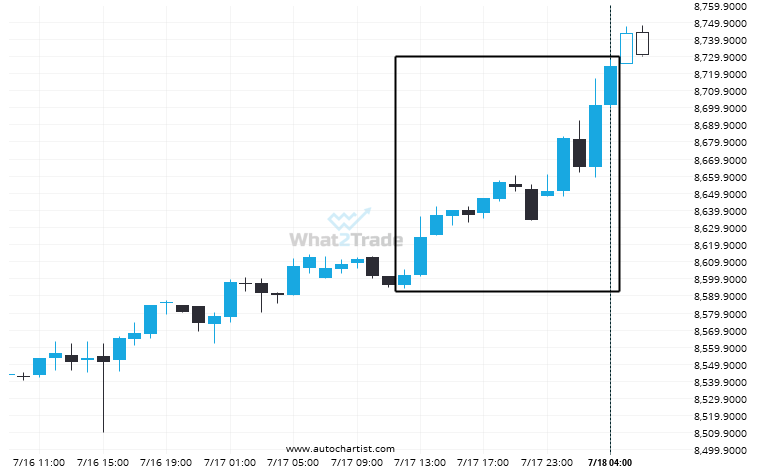
Could a large bullish move on ASX 200 be a sign of things to come?
ASX 200 has experienced an extremely big movement in last 16 hours. It may continue the…
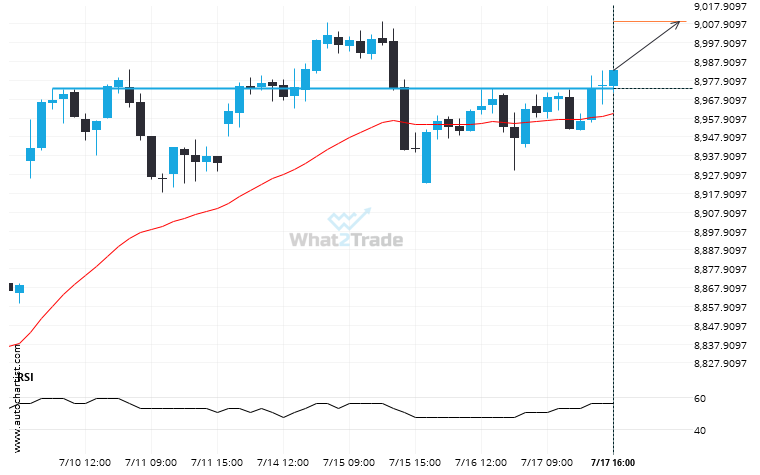
Important price line breached by FTSE 100. This price has been tested numerous times before.
FTSE 100 has broken through a resistance line. It has touched this line numerous times in…
Futures
Important price line breached by Brent Crude. This price has been tested numerous times before.
Brent Crude has broken through 69.9835 which it has tested numerous times in the past. We…
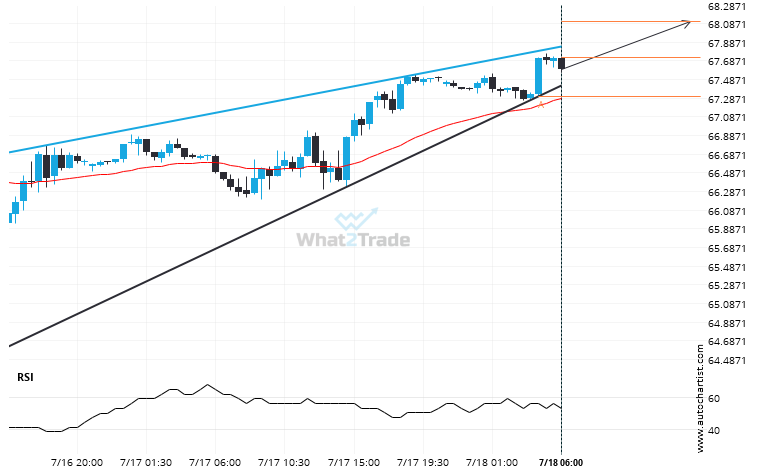
A Rising Wedge has formed, US Oil is approaching support. Can we expect a breakout and the start of a new trend or a reversal?
US Oil is heading towards the resistance line of a Rising Wedge and could reach this point…
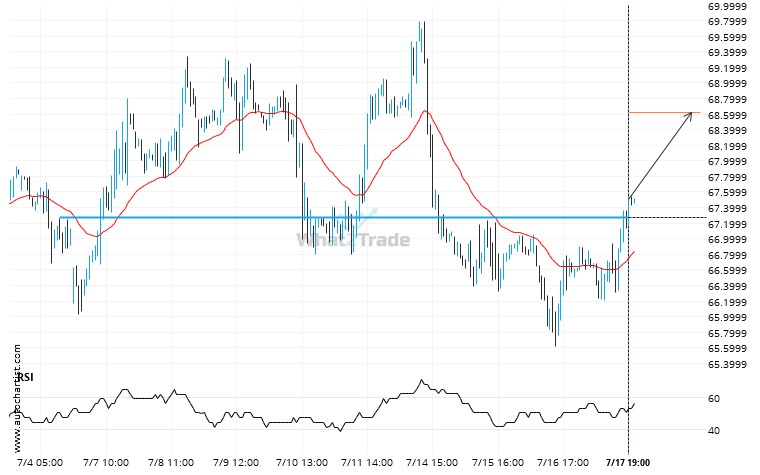
Big movement possible on US Oil after a breach of 67.2755
US Oil has breached the resistance line at 67.2755. It may continue the bullish trend…

