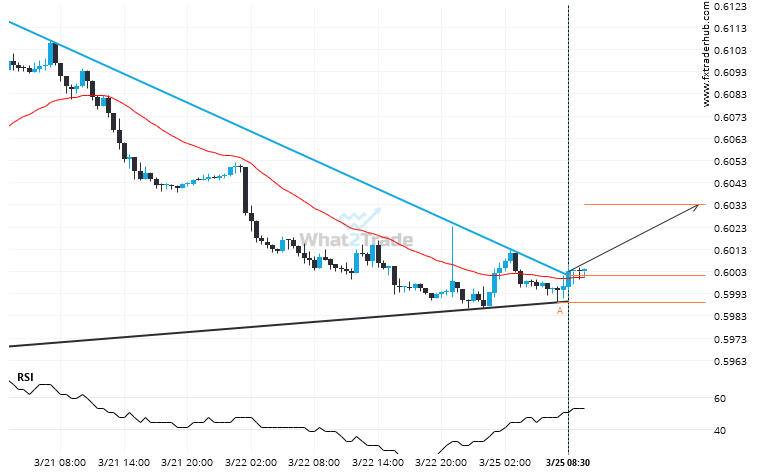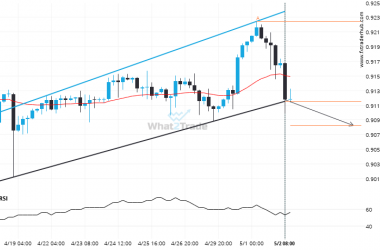
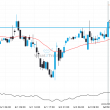
NZD/USD moved through the resistance line of a Triangle at 0.6001140229885056 on the 30 Minutes chart. This line has been tested a number of times in the past and this breakout could mean an upcoming change from the current trend. It may continue in its current direction toward 0.6033.
NZD/USD through 0.6001140229885056. Is this a confirming a breakout? Will it continue its path in the current trend toward 0.6033?