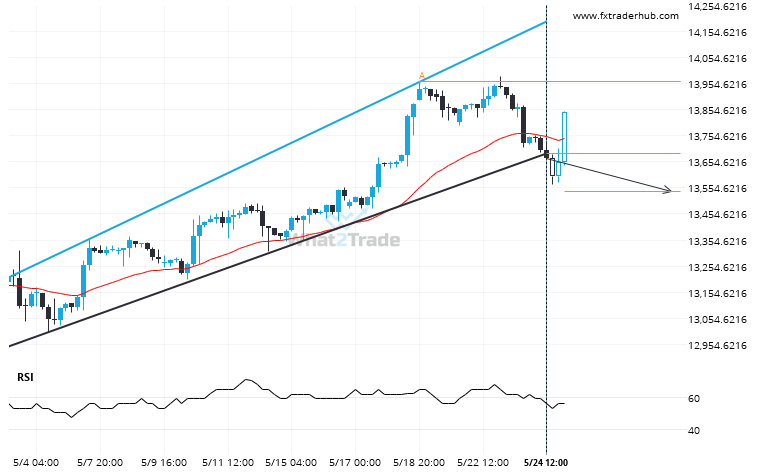
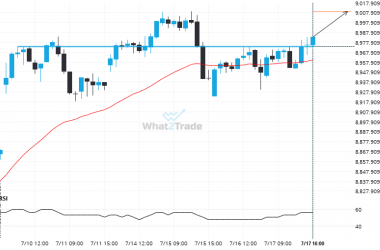
NAS100 has broken through a support line. It has touched this line at least twice in the last 24 days. This breakout may indicate a potential move to 13540.3825 within the next 5 days. Because we have seen it retrace from this position in the past, one should wait for confirmation of the breakout before trading.
Related Posts
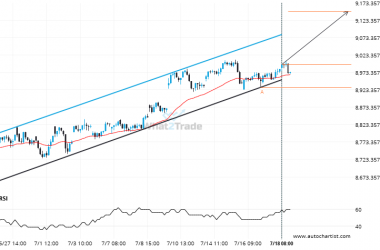
After testing the resistance line numerous times, FTSE 100 is once again approaching this line. Can we expect a bullish trend to follow?
The movement of FTSE 100 towards the resistance line of a Channel Up is yet another test of…
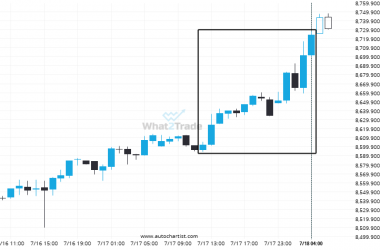
Could a large bullish move on ASX 200 be a sign of things to come?
ASX 200 has experienced an extremely big movement in last 16 hours. It may continue the trend, but…
Important price line breached by FTSE 100. This price has been tested numerous times before.
FTSE 100 has broken through a resistance line. It has touched this line numerous times in the last…

