Receive the latest alerts via email

GBP/CAD Target Level: 1.7274

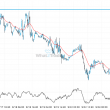
Falling Wedge identified at 18-Dec-2019 20:30 UTC. This pattern is still in the process of forming. Possible bullish price movement towards the resistance 1.7274 within the next 11 hours. Supported by RSI below 40 Chart 30 MinutesPattern Falling WedgeLength 77 CandlesIdentified 18-Dec-2019 20:30 UTC

Falling Wedge identified at 18-Dec-2019 20:30 UTC. This pattern is still in the process of forming. Possible bullish price movement towards the resistance 1.7274 within the next 11 hours. Supported by RSI below 40

Chart 30 Minutes
Pattern Falling Wedge
Length 77 Candles
Identified 18-Dec-2019 20:30 UTC

Total
0
Shares
Previous Post

Big movement expected on CORN MARCH 2020 after a breach of 386.2500

Next Post

After testing 109.7270 numerous times, USD/JPY is once again approaching this price point. Can we expect a bullish trend to follow?

Related Posts