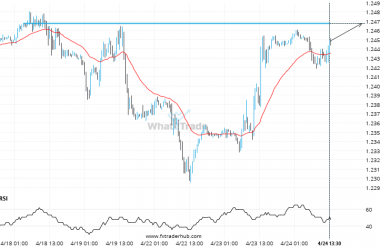
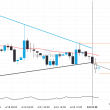

Falling Wedge identified at 18-Dec-2019 20:30 UTC. This pattern is still in the process of forming. Possible bullish price movement towards the resistance 1.7274 within the next 11 hours. Supported by RSI below 40
Chart 30 Minutes
Pattern Falling Wedge
Length 77 Candles
Identified 18-Dec-2019 20:30 UTC