


Browsing Category
Indices mondiaux
7095 messages
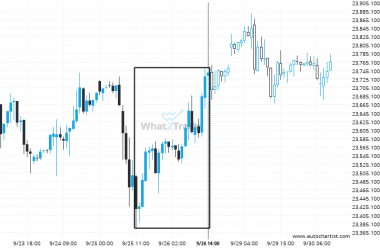
Big bullish swing on DAX 40 – this may be one of its more notable movements in the recent session.
A movement of 1.66% over 4 days on DAX 40 doesn’t go unnoticed. You may start considering where…
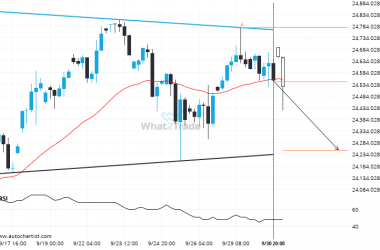
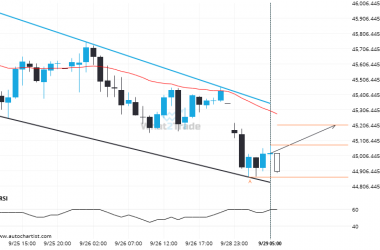
A possible move on NAS 100 as it heads towards support
NAS 100 is approaching the support line of a Triangle. It has touched this line numerous times in…
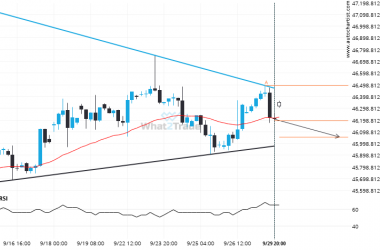
DOW 30 is approaching 46089.0000. We expect either a breakout through this line, or a rebound.
DOW 30 is heading towards a line of 46089.0000. If this movement continues, the price of DOW 30…
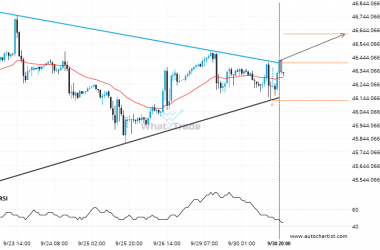
After testing resistance twice in the past, DOW 30 has finally broken through. Can we expect a bullish trend to follow?
DOW 30 has broken through a resistance line of a Triangle and suggests a possible movement to 46612.9534…
Extreme movement experienced on DAX 40. Check the chart to see what to do next.
DAX 40 just posted a 1.37% move over the past 2 days – a move that won’t go…
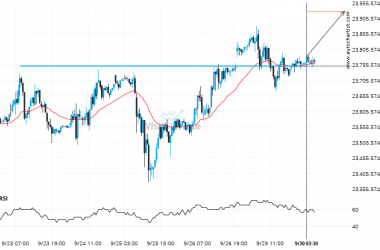
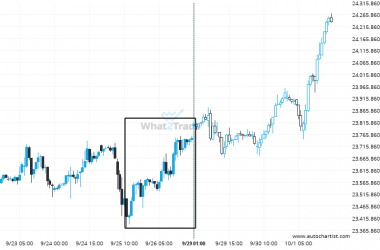
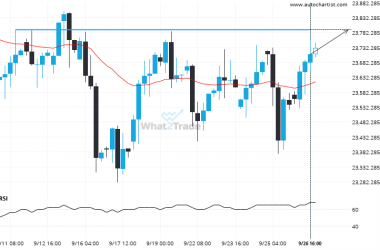
After testing 23751.1992 numerous times, DAX 40 has finally broken through. Can we expect a bullish trend to follow?
DAX 40 has broken through a resistance line. Because we have seen it retrace from this price in…
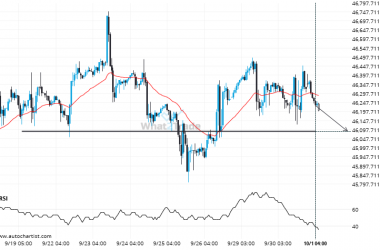
Important support line being approached by DOW 30. This price has been tested numerous time in the last 19 days
DOW 30 is moving towards a support line which it has tested numerous times in the past. We…
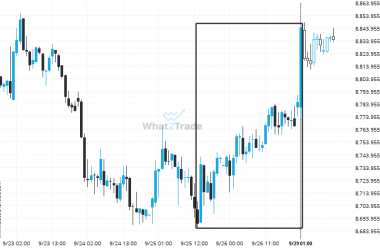
ASX 200 experienced a 1.78% bullish move in just 4 days. The magnitude speaks for itself.
ASX 200 has moved higher by 1.78% from 8689.4 to 8844.2 in the last 4 days.
A possible move on Nikkei 225 as it heads towards resistance
Emerging Channel Down pattern in its final wave was identified on the Nikkei 225 1 hour chart. After…
DAX 40 heading towards a price it has tested 4 times in the recent past.
DAX 40 is approaching a resistance line at 23791.3008. If it hits the resistance line, it may break…