

Browsing Category
Global Indices
6155 posts
After testing support twice in the past, FRA40 has finally broken through. Can we expect a bearish trend to follow?
FRA40 has broken through a support line of a Triangle chart pattern. If this breakout holds true, we…
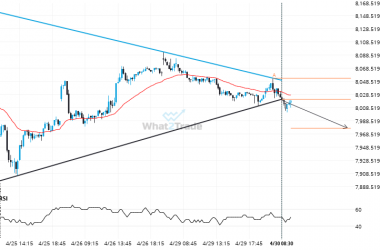
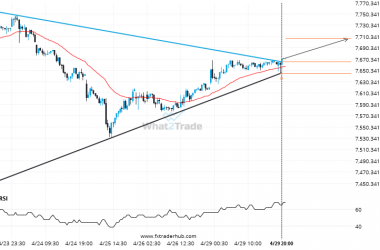
Support line breached by UK100. This price has been tested at least twice before.
UK100 has broken through a support line of a Rising Wedge chart pattern. If this breakout holds true,…

Interesting opportunity on US30 after breaking 38495.6
The last 47 Daily candles on US30 formed a Triangle pattern and broken out through the pattern lines,…
There is a possibility of a big movement on AUS200 after a breach of the resistance
AUS200 has broken through a resistance line. It has touched this line at least twice in the last…
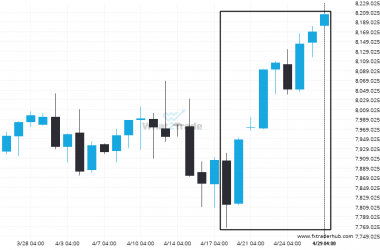
UK100 – It’s perhaps in these huge moves where the greatest opportunity lies
A movement of 5.01% over 12 days on UK100 doesn’t go unnoticed. You may start considering where it’s…
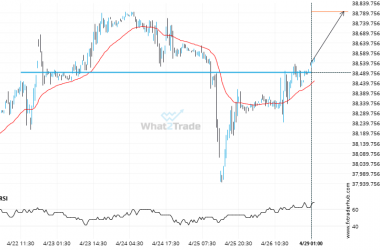
Big movement possible on US30 after a breach of 38492.0000
US30 has broken through a resistance line. It has touched this line numerous times in the last 7…
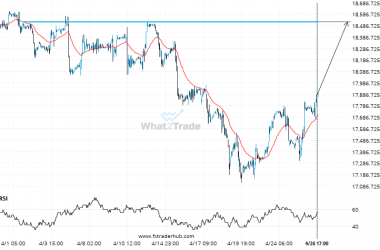
If NAS100 touches 18518.7500 it may be time to take action.
NAS100 is moving towards a key resistance level at 18518.7500. This is a previously tested level for NAS100.…
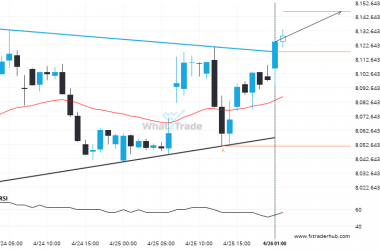
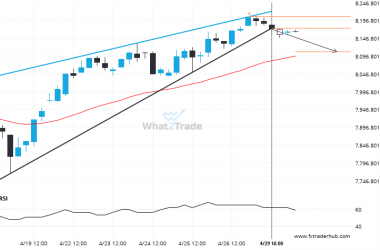
UK100 broke through a resistance at 2024-04-26T02:00:00.000Z, with the price momentum continuing to move in an upward direction over the next hours, good opportunity presents itself with the price expected to reach 8146.6030.
The breakout of UK100 through the resistance line of a Triangle could be a sign of the road…
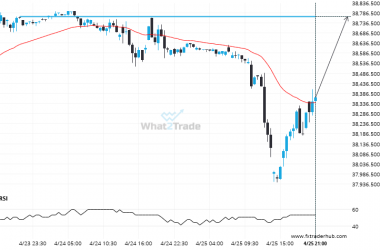
US30 – approaching a price line that has been previously tested numerous times in the past
The movement of US30 towards 38767.0000 price line is yet another test of the line it reached numerous…
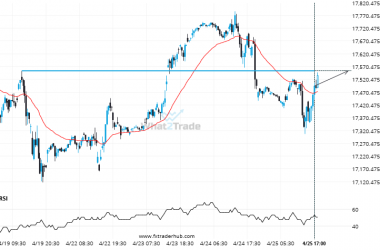
NAS100 is approaching 17553.2500. We expect either a breakout through this line, or a rebound.
NAS100 is moving towards a key resistance level at 17553.2500. NAS100 has previously tested this level 3 times…