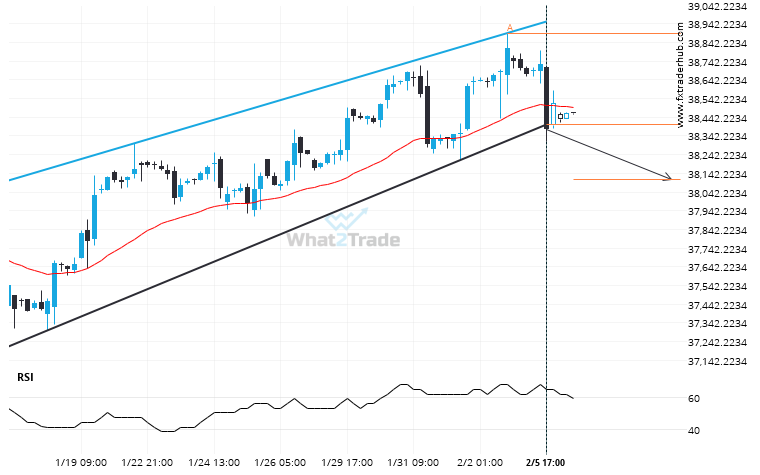
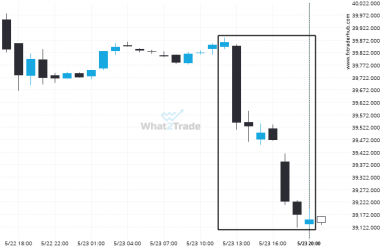
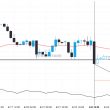
US30 moved through the support line of a Channel Up at 38402.59677419355 on the 4 hour chart. This line has been tested a number of times in the past and this breakout could mean an upcoming change from the current trend. It may continue in its current direction toward 38110.6993.
Related Posts
NAS100 through 18758.653846153848. Is this a confirming a breakout? Will it continue its path in the current trend toward 18534.8877?
NAS100 has broken through the support line which it has tested twice in the past. We have seen…
An unexpected large move has occurred on US30 1 hour chart! Is this a sign of something new? What can we expect?
US30 has moved lower by 1.79% from 39863.0 to 39151.0 in the last 8 hours.
Interesting opportunity on FRA40 after breaking 8104.25
FRA40 has broken through the resistance line of a Falling Wedge technical chart pattern. Because we have seen…