
Day: August 27, 2019
24 messages
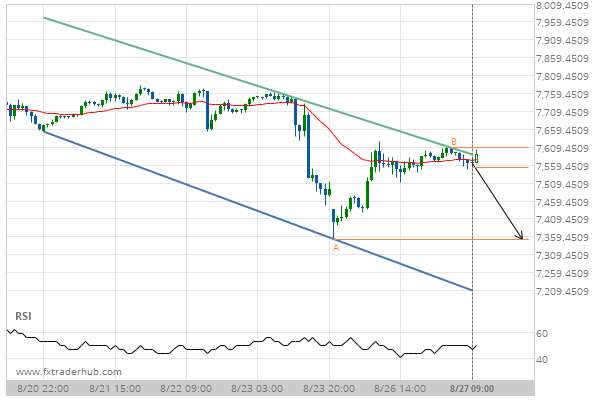
UK100 is approaching a resistance line of a Channel Down. It has touched this line numerous times in the last 8 days.
UK100 is approaching the resistance line of a Channel Down. It has touched this line numerous times in…
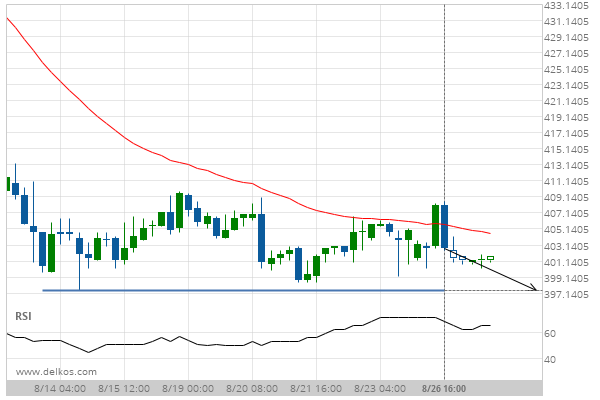
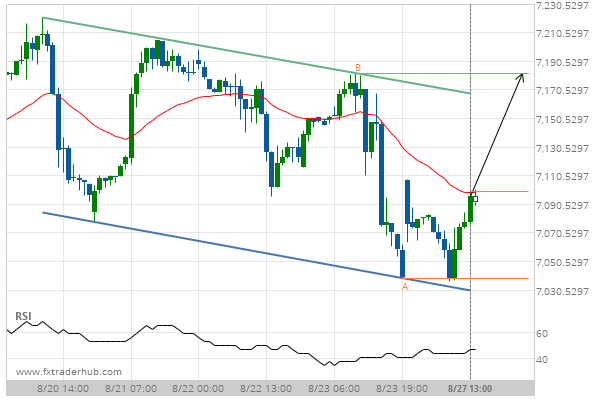
KC HRW Wheat DECEMBER 2019 is quickly approaching 397.5000. We expect either a breakout through this line, or a rebound.
KC HRW Wheat DECEMBER 2019 is heading towards a line of 397.5000. If this movement continues, we expect…
Important resistance line being approached by LTCCAD. This price has been tested numerous time in the last 2 days
LTCCAD is moving towards the resistance line of a Channel Up which it has tested numerous times in…
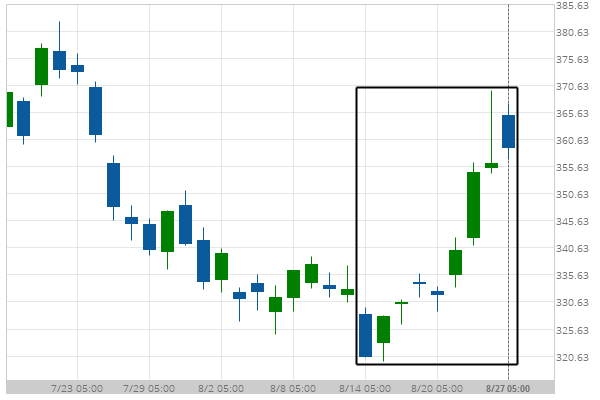
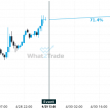
Boeing Co. hits 358.87 after a 9.29% move spanning 14 days
For those of you that don’t believe in trends, this may be an opportunity to take advantage of…
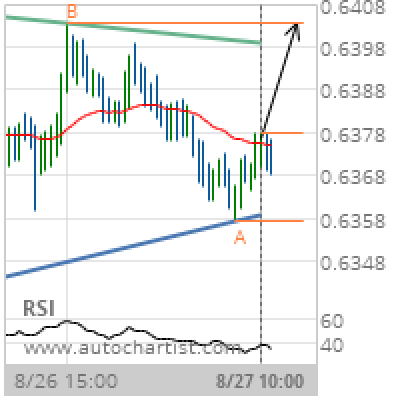
NZD/USD Target Level: 0.6403
Triangle identified at 27-Aug-2019 10:00 UTC. This pattern is still in the process of forming. Possible bullish price movement towards the resistance 0.6403 within the next 13 hours. Supported by RSI below 40 Chart 30 MinutesPattern TriangleLength 84 CandlesIdentified 27-Aug-2019 10:00 UTC
NAS100 is quickly approaching the support line of a Channel Down. We expect either a breakout through this line or a rebound.
NAS100 is heading towards the support line of a Channel Down. If this movement continues, we expect the…
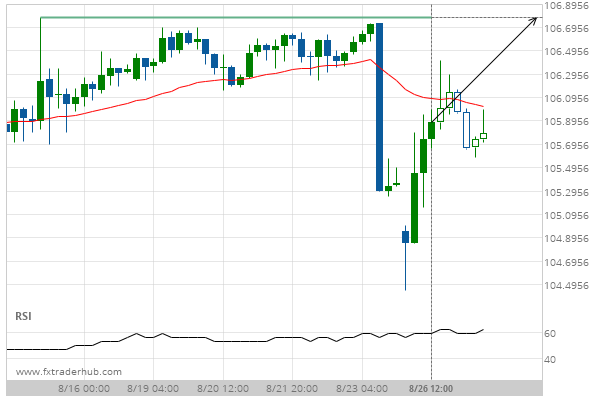
USD/JPY is approaching the resistance line of a Resistance. It has touched this line numerous times in the last 12 days.
USD/JPY is approaching the resistance line of a Resistance. It has touched this line numerous times in the…

Important resistance line being approached by LTCCAD. This price has been tested numerous time in the last 2 days
LTCCAD is moving towards the resistance line of a Channel Up which it has tested numerous times in…
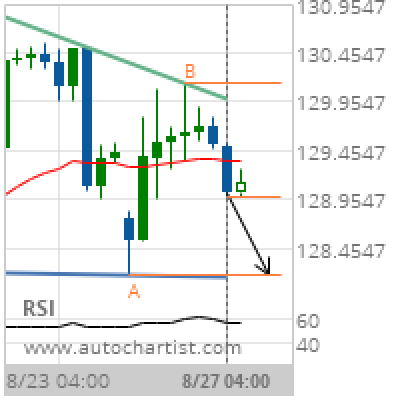
GBP/JPY Target Level: 128.1810
Descending Triangle identified at 27-Aug-2019 04:00 UTC. This pattern is still in the process of forming. Possible bearish price movement towards the support 128.1810 within the next day. Supported by Downward sloping Moving Average Chart 4 hourPattern Descending TriangleLength 29 CandlesIdentified 27-Aug-2019 04:00 UTC
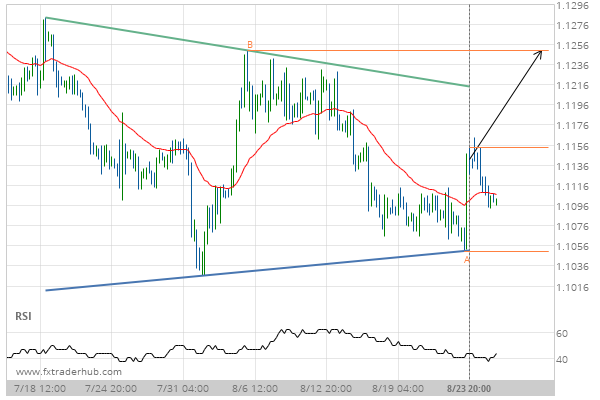
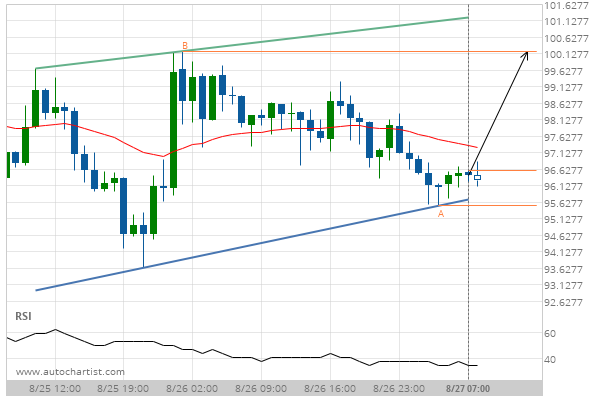
A quick move expected on EUR/USD as it starts approaching a resistance line of a Triangle
EUR/USD is heading towards the resistance line of a Triangle and could reach this point within the next…