
Day: August 8, 2019
27 messages
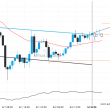
USD/CAD – approaching a price line that has been previously tested numerous times in the past
USD/CAD is moving towards the support line of a Support. Because we have seen it retrace from this…
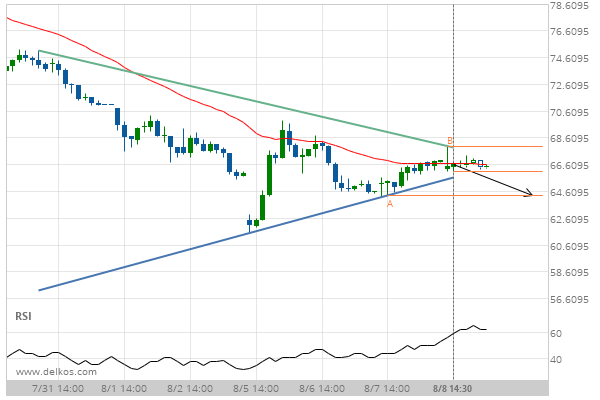
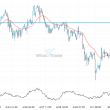
A quick move expected on Lean Hogs OCTOBER 2019 as it starts approaching a support line of a Triangle
Lean Hogs OCTOBER 2019 is heading towards the support line of a Triangle and could reach this point…
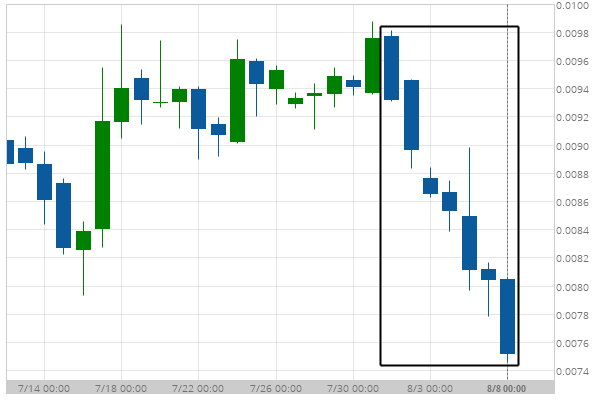
LTCBTC experienced a very large 8 days bearish move to 0.008
LTCBTC has moved lower by 22.87% from 0.01 to 0.008 in the last 8 days.
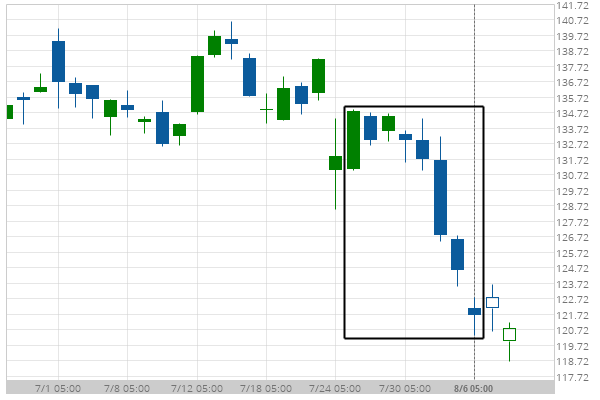
Could a large bearish move on Caterpillar Inc. be a sign of things to come?
Caterpillar Inc. has experienced an exceptionally large movement lower by 7.19% from 131.08 to 121.65 in the last…
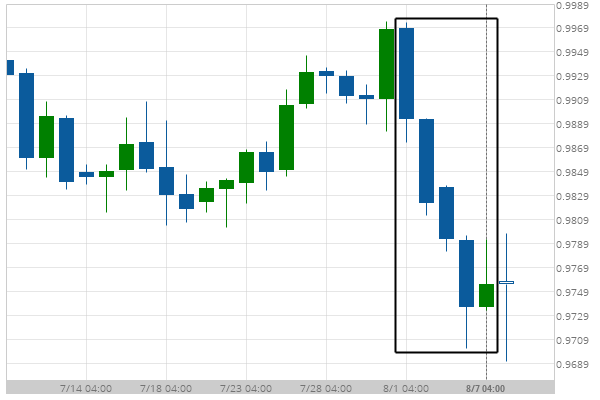
USD/CHF moves lower to 0.976 in the last 7 days.
A movement of 2.14% over 7 days on USD/CHF doesn’t go unnoticed. You may start considering where it’s…
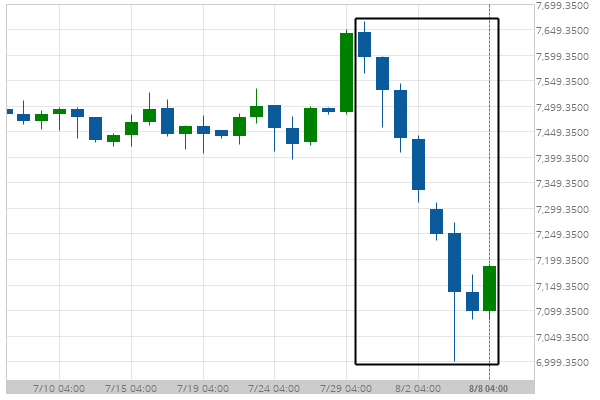
UK100 moves lower to 7,186 in the last 10 days.
A movement of 5.98% over 10 days on UK100 doesn’t go unnoticed. You may start considering where it’s…
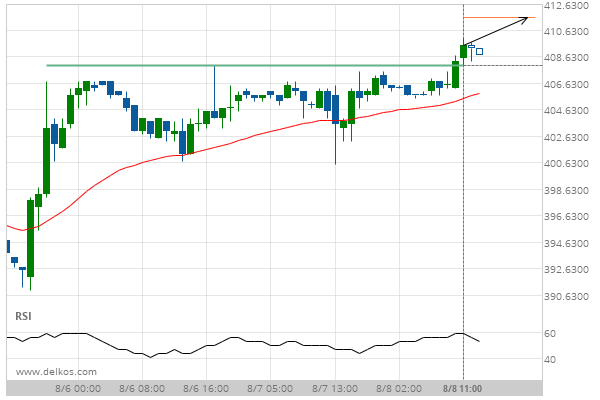
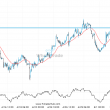
After testing 408.0000 numerous times, CORN SEPTEMBER 2019 has finally broken through. Can we expect a bullish trend to follow?
The breakout of CORN SEPTEMBER 2019 through the 408.0000 price line is a breach of an important psychological…
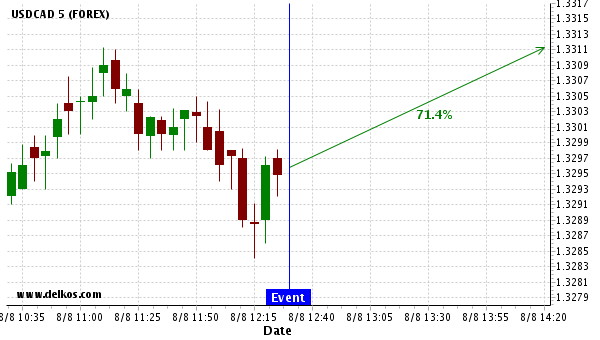
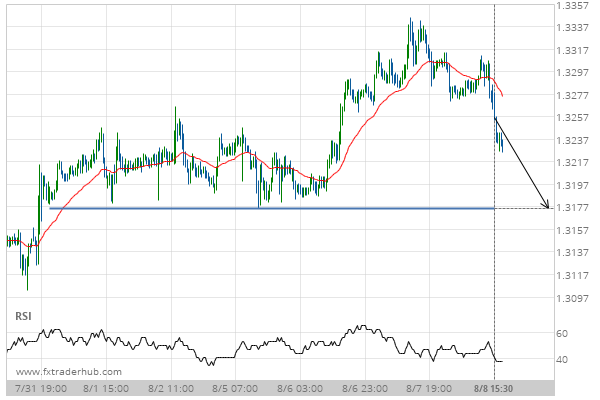
We expect USDCAD to trend upwards for the next 2 hours.
Based on the last 12 Continuing Jobless Claims events in United States, we expect USDCAD to trend upwards…
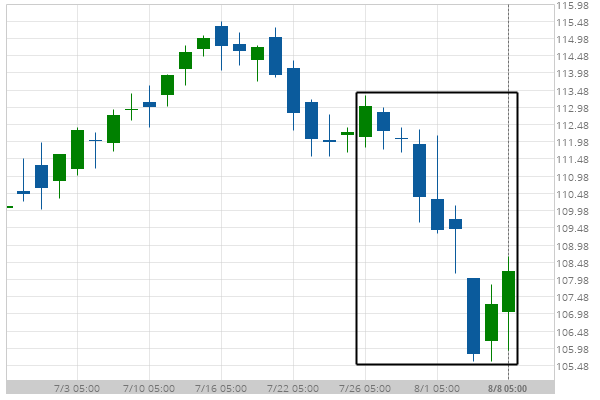
Wal-Mart Stores moves lower to 108.23 in the last 14 days.
A movement of 3.47% over 14 days on Wal-Mart Stores doesn’t go unnoticed. You may start considering where…
Analyzing Trading Algos with 3D Charts
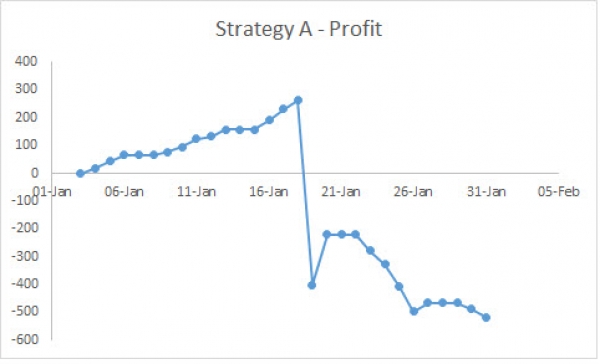
These days, any mention of the term 3D is associated with entertainment. But in fact, when it comes to charting, and more specifically to charting your trading algo, 3D charting is not only insightful but provides important practical advantages. The most common chart to measure a trading algo is profit over time. That lets you…