
Day: May 20, 2019
18 messages
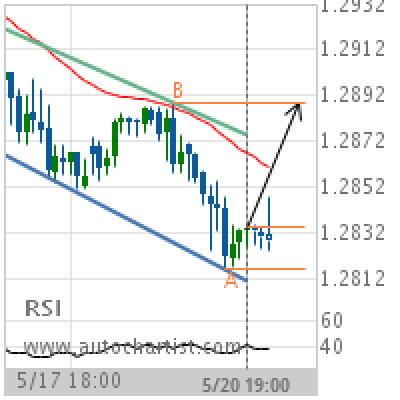
GBP/CHF Target Level: 1.2889
Channel Down identified at 20-May-2019 19:00 UTC. This pattern is still in the process of forming. Possible bullish price movement towards the resistance 1.2889 within the next 16 hours. Supported by RSI below 40 Chart 1 hourPattern Channel DownLength 58 CandlesIdentified 20-May-2019 19:00 UTC
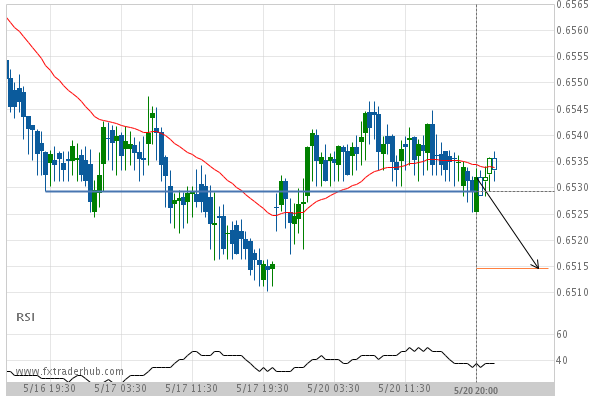
Important price line breached by NZD/USD. This price has been tested numerous times before.
NZD/USD has broken through a line of 0.6529 which it has tested numerous times in the past. We…
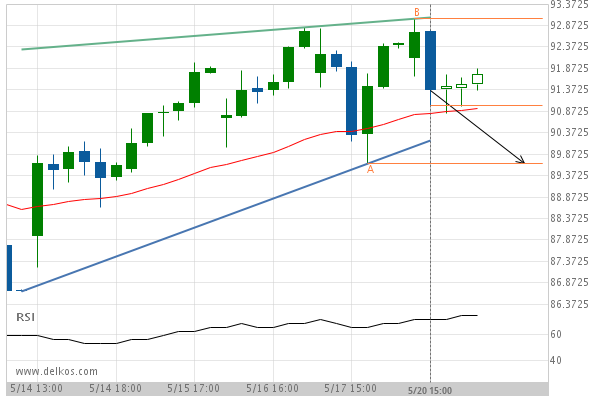
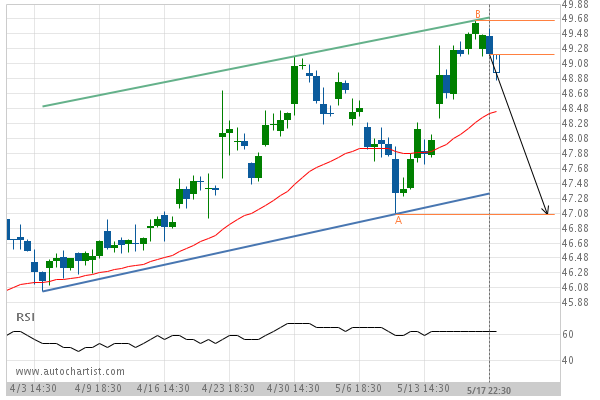
Lean Hogs JUNE 2019 – approaching a support line that has been previously tested at least twice in the past
Lean Hogs JUNE 2019 is moving towards the support line of a Rising Wedge. Because we have seen…
A quick move expected on International Business Machines Corp. as it starts approaching a support line of a Channel Down
International Business Machines Corp. is heading towards the support line of a Channel Down and could reach this…
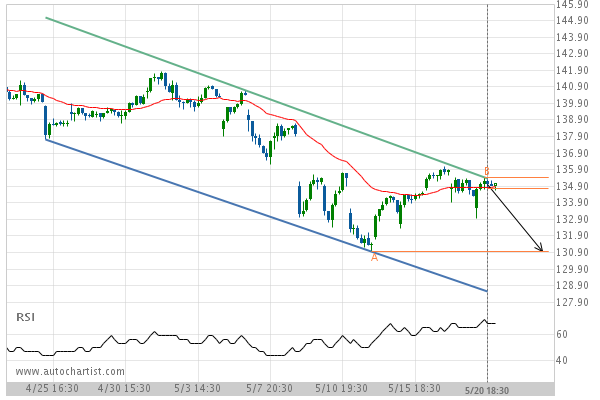
After testing the support line numerous times, FRA40 is once again approaching this line. Can we expect a bearish trend to follow?
The movement of FRA40 towards the support line of a Falling Wedge is yet another test of the…
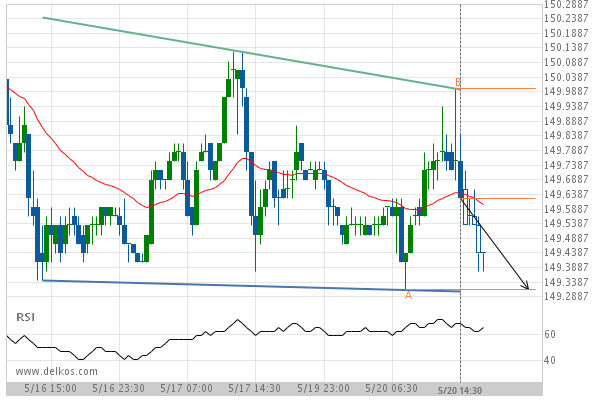
Important support line being approached by US Treasury Bond JUNE 2019. This price has been tested numerous time in the last 5 days
US Treasury Bond JUNE 2019 is moving towards the support line of a Descending Triangle which it has…
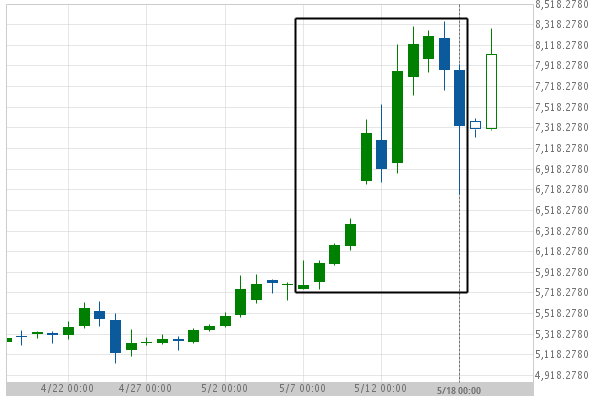
BTCUSD moves higher to 7,873.9 in the last 12 days.
A movement of 36.98% over 12 days on BTCUSD doesn’t go unnoticed. You may start considering where it’s…
Coca-Cola Co. is approaching a support line of a Channel Up. It has touched this line numerous times in the last 45 days.
Coca-Cola Co. is approaching the support line of a Channel Up. It has touched this line numerous times…
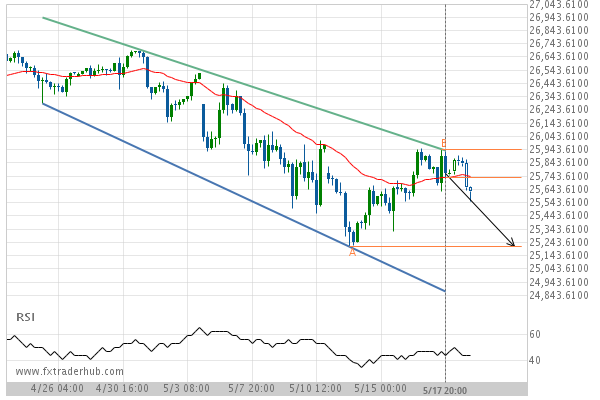
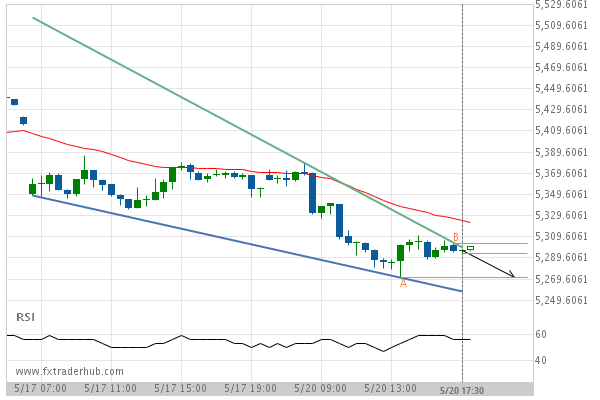
US30 is quickly approaching the support line of a Channel Down. We expect either a breakout through this line or a rebound.
US30 is heading towards the support line of a Channel Down. If this movement continues, we expect the…
10 year US Treasury Note JUNE 2019 – breach of a trending support line that has been tested at least twice before.
10 year US Treasury Note JUNE 2019 has broken through the support line of a Triangle technical chart…