

Day: May 7, 2019
33 messages
Wheat JULY 2019 is approaching a support line of a Triangle. It has touched this line numerous times in the last 7 days.
Wheat JULY 2019 is approaching the support line of a Triangle. It has touched this line numerous times…
Important resistance line being approached by General Electric Co.. This price has been tested numerous time in the last 7 days
General Electric Co. is moving towards the resistance line of a Ascending Triangle which it has tested numerous…
After testing the resistance line numerous times, ETHUSD is once again approaching this line. Can we expect a bullish trend to follow?
The movement of ETHUSD towards the resistance line of a Channel Up is yet another test of the…
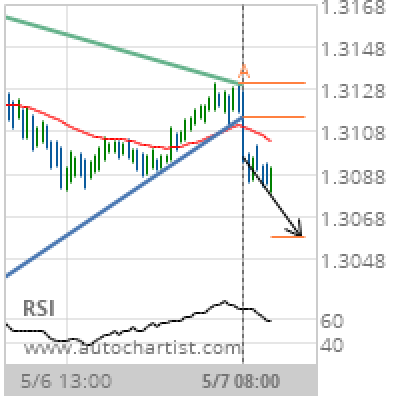
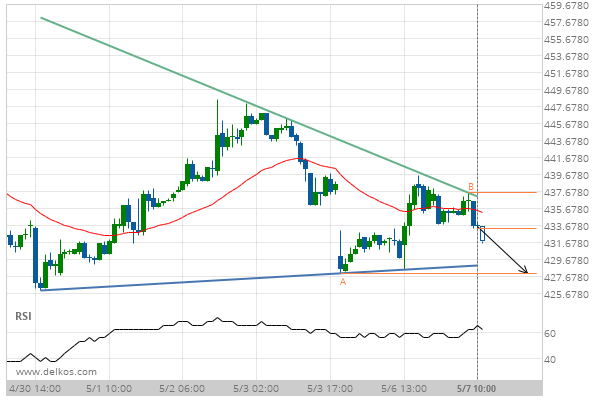
GBP/USD Target Level: 1.3058
Triangle has broken through the support line at 07-May-2019 08:00 UTC. Possible bearish price movement forecast for the next 11 hours towards 1.3058. Supported by Downward sloping Moving Average Chart 30 MinutesPattern TriangleLength 86 CandlesIdentified 07-May-2019 08:00 UTC
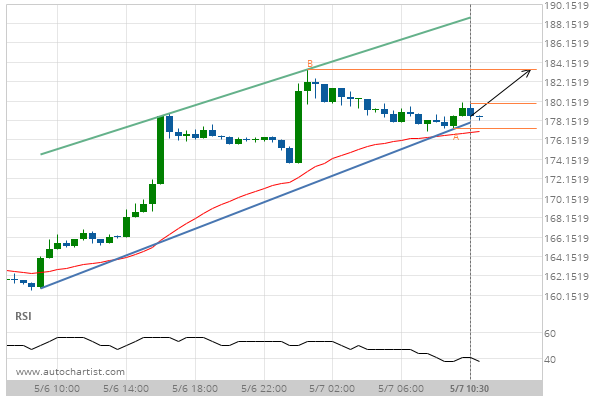
Important resistance line being approached by 10 year US Treasury Note JUNE 2019. This price has been tested numerous time in the last 6 days
10 year US Treasury Note JUNE 2019 is moving towards the resistance line of a Ascending Triangle which…
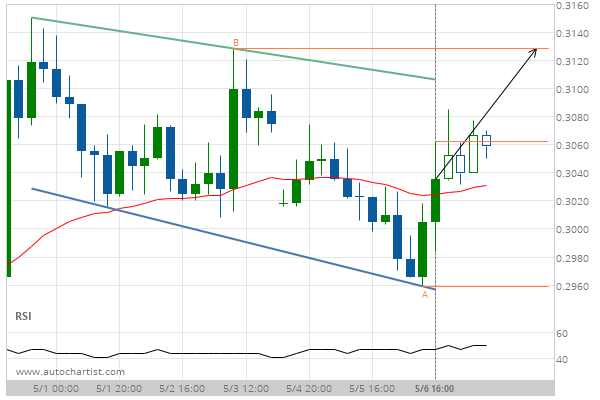
A quick move expected on XRPUSD as it starts approaching a resistance line of a Channel Down
XRPUSD is heading towards the resistance line of a Channel Down and could reach this point within the…
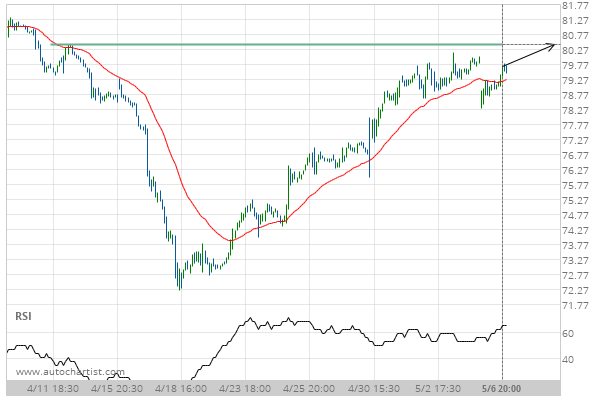
After testing 80.43 numerous times, Merck & Co. Inc. is once again approaching this price point. Can we expect a bullish trend to follow?
The movement of Merck & Co. Inc. towards 80.43 price line is yet another test of the line…
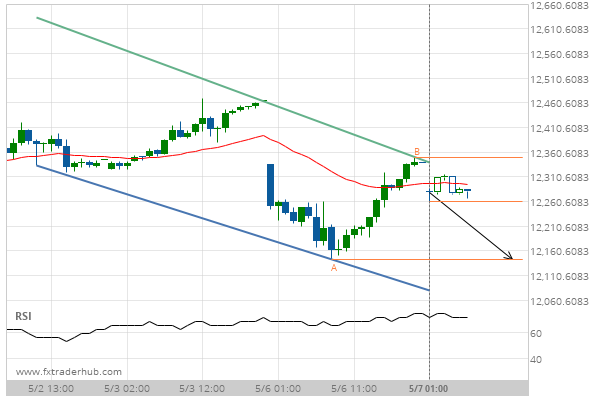
GER30 is quickly approaching the support line of a Channel Down. We expect either a breakout through this line or a rebound.
GER30 is heading towards the support line of a Channel Down. If this movement continues, we expect the…
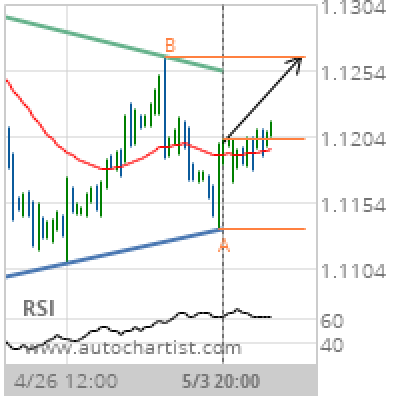
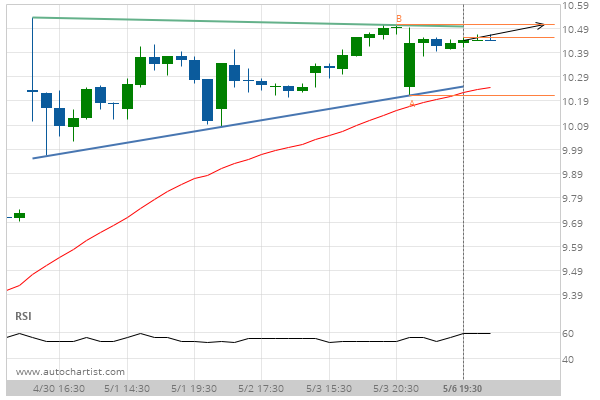
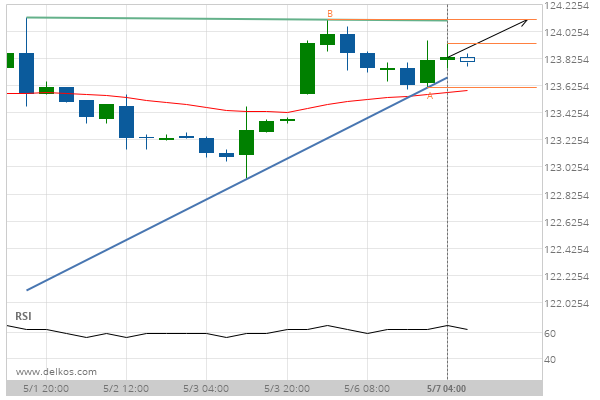
EUR/USD Target Level: 1.1264
Triangle identified at 03-May-2019 20:00 UTC. This pattern is still in the process of forming. Possible bullish price movement towards the resistance 1.1264 within the next 17 hours. Supported by Upward sloping Moving Average Chart 4 hourPattern TriangleLength 77 CandlesIdentified 03-May-2019 20:00 UTC
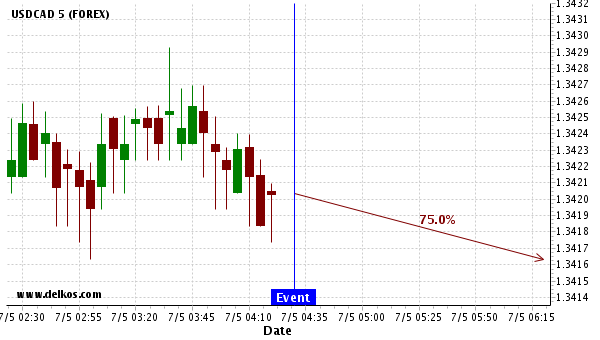
Are you on the right side of the AU RBA Interest Rate Decision news event?
Are you on the right side of the AU RBA Interest Rate Decision news event?