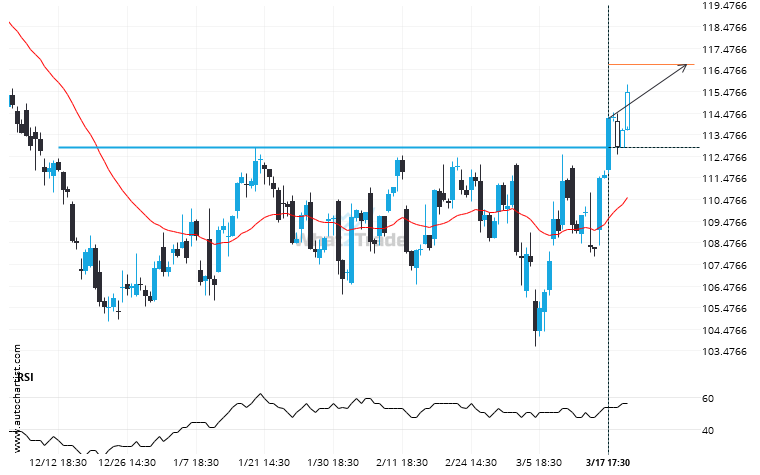
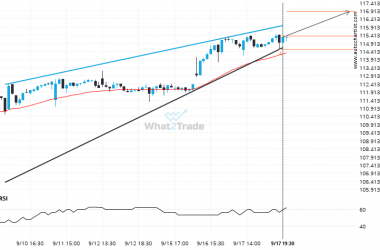
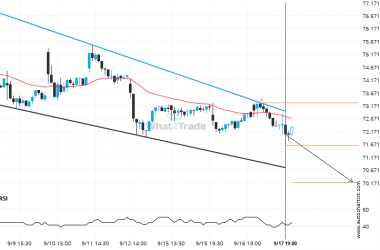
XOM has broken through a resistance line. Because we have seen it retrace from this price in the past, one should wait for confirmation of the breakout before trading. It has touched this line numerous times in the last 95 days and suggests a possible target level to be around 116.7460 within the next 3 days.
ARTÍCULOS RELACIONADOS
A possible move on XOM as it heads towards resistance
XOM is heading towards the resistance line of a Rising Wedge and could reach this point within the…
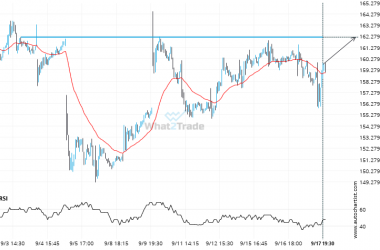
AMD keeps moving closer towards 162.2200. Will it finally breach this level?
AMD is en route to a very important line that will be a definite deciding factor of what…
NKE – approaching a support line that has been previously tested at least twice in the past
Emerging Falling Wedge detected on NKE – the pattern is an emerging one and has not yet broken…

