Receive the latest alerts via email

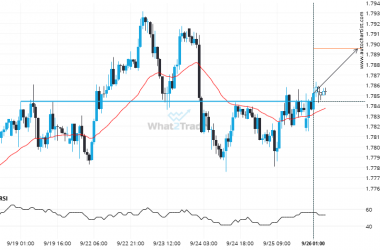
XAG/USD Target Level: 14.8700

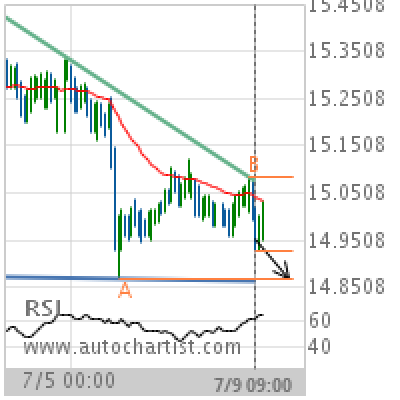
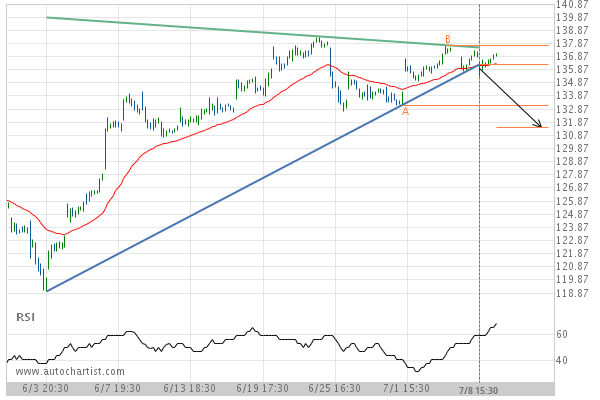
Descending Triangle identified at 09-Jul-2019 09:00 UTC. This pattern is still in the process of forming. Possible bearish price movement towards the support 14.8700 within the next 2 days. Supported by RSI above 60 Chart 1 hourPattern Descending TriangleLength 127 CandlesIdentified 09-Jul-2019 09:00 UTC
XAG/USD Target Level: 14.8700

Descending Triangle identified at 09-Jul-2019 09:00 UTC. This pattern is still in the process of forming. Possible bearish price movement towards the support 14.8700 within the next 2 days. Supported by RSI above 60

Chart 1 hour
Pattern Descending Triangle
Length 127 Candles
Identified 09-Jul-2019 09:00 UTC

Total
0
Shares
Previous Post

Support line breached by GER30. This price has been tested at least twice before.

Next Post

After testing support twice in the past, Microsoft Corporation has finally broken through. Can we expect a bearish trend to follow?

ARTÍCULOS RELACIONADOS