Repainting indicators are one of the most common problems facing would-be EA designers. Sometimes it seems like an indicator has its thumb on the market. It perfectly predicts when the market will go up or down. So making an EA run off of the indicator is a no-brainer.
If this sounds familiar, you need to consider whether or not the indicator repaints.
What is a repainting indicator?
First, consider a baseball analogy. Last week, the St. Louis Cardinals beat the Texas Rangers to win the World Series. A repainting indicator is like asking you today, “Would you bet on the Cardinals or Rangers?” then pretending like you placed your bet three weeks ago and not today. You had no way of knowing for sure who would win.
How do Normal Indicators Work?
If that sounds stupid, it’s because it is. Repainting indicators use knowledge of the “historical future” to forecast which way the market is going to go. Indicators typically start with old bars on the left side of the chart, then walk forward to the right side until they obtain enough information to make a decision. Say, for example, that you want to create the RSI indicator on a daily chart, and you want to start on October 25. You start at October 25, and make decisions based on information from Oct. 24, 23, etc., until you’ve collected 14 bars worth of data or however long you set the period. You then say definitively that the RSI on October 25 is X.
Now you move on to October 26. You look back at October 25, 24, and so on, until you get the final RSI value for October 26. All of the examples move forward into the future, then look back into the past to get the current value.
A Hypothetical Repainting Indicator
Now let’s make a hypothetical RSI indicator that repaints. Say our first date under consideration is October 25. We might start by looking into the past, which is what we did last time. But for the sake of making the example obvious, let’s look the other way – into the future.
We gather data from October 26, 27, and so on. Now, having learned the future, we jump back to October 25 and pretend that we knew the future all along. The RSI looks amazing.
An Actual Example
I receive copies of the 3_Level_ZZ_Semafor every once in a while and it tends to cause problems. It’s based on the same idea as the zig-zag indicator, which helps it to pick perfect tops and bottoms. Trend traders love looking at it. The information seems like it would be so valuable.
Making an EA off of it, however, presents numerous problems. The trades that the Expert Advisor makes do not match up with what the indicator looks like a few hours later. What actually happens is that the indicator changes its mind. It doesn’t leave behind any evidence of its incorrect prediction. The novice EA designer naturally concludes that the programming is all wrong and that we need to fix it.
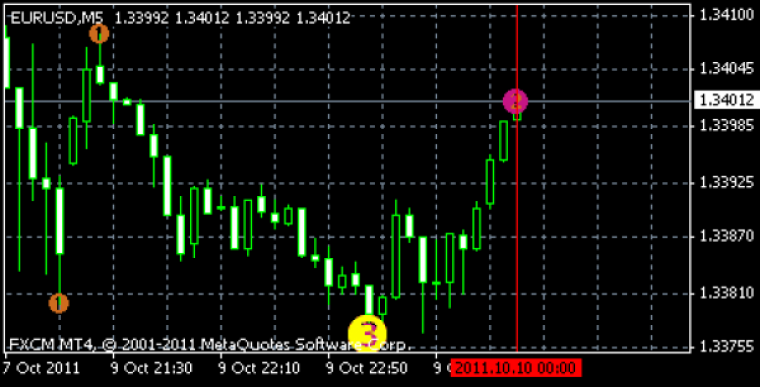
The first image below shows the value of the semafor on a EURSUD M5 chart at 00:00 on October 10, 2011. You’ll notice that a purple dot with the number 2 appears on that bar. The market is moving strongly upwards. The indicator at this point predicts that the move is likely overextended.
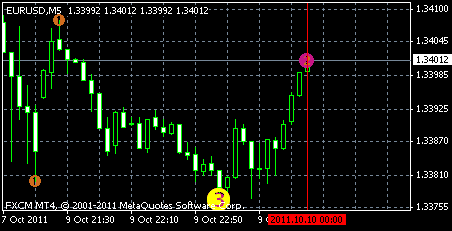
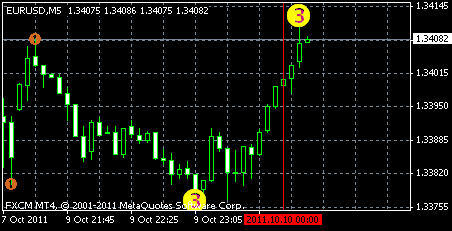
If we jump 2 bars into the future at 00:10, now magically a number 3 dot appears. What’s worse is that the number 2 dot disappears entirely from the 00:00 bar! The indicator sees that the price jumped up, so it goes back in time and deletes the evidence of its incorrect prediction. If you weren’t watching the indicator or taking screenshots, it is as though the number 2 dot was never there.
Look out for Repainting
No automated process exists to determine whether or not your indicator repaints. It’s something that you have to do by staring at the chart during a backtest to see if the values change or not.
I like to do this by selecting an Expert Advisor without caring too much about which one I pick. If you don’t have any installed, you can grab one from the free Expert Advisor page for the sake of testing.
You’ll need to select settings to get the backtester to run. The options that you choose are not important, so long as you have selected something. I highlighted the required items in red below. I personally prefer to use M5 EURUSD charts. M5 is good because the backtester moves over the data quickly on full speed without going so fast that I cannot control the process. It strikes a nice balance between speed and following what’s actually happening. I like EURUSD simply because I always have EURUSD data loaded. I don’t have to worry about the tester not working, whereas that would likely be an issue if I selected an exotic currency like TRY/ZAR.

When the visual backtest chart pops up, the first thing to do is to load your indicator onto the chart. As the test progresses, watch how the indicator behaves. Some repainting indicators like the Semafor are completely obvious. They repaint on most bars, so it’s easy to tell that it is not consistent. You can safely assume that it repaints.
Other indicators are more tricky. They only plot once every 50 bars and sometimes even less frequently. You have to watch closely to make sure that where plots appear, that they don’t subsequently dance onto another bar. I like to use the same technique in the first screenshot that I posted with a vertical red line. Whenever the indicator plots something on the chart, mark it with a vertical line. Continue doing so for about a day’s worth of data on the M5 chart. Stop the test, then scroll back through the chart. If 100% of the plotted values match the vertical lines, then your indicator does not repaint.


