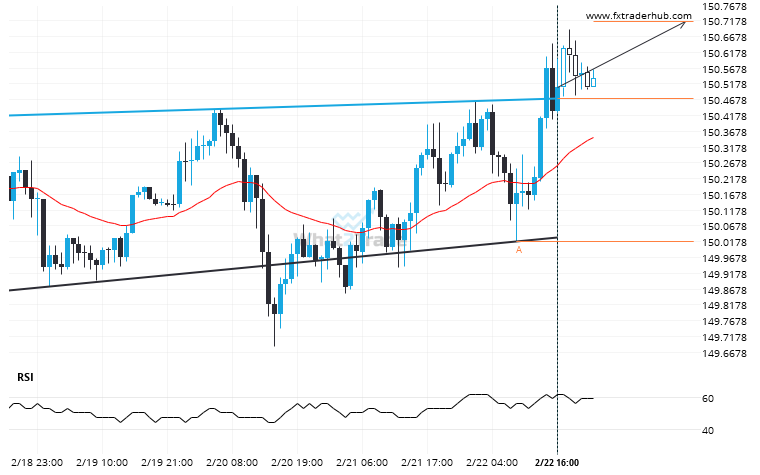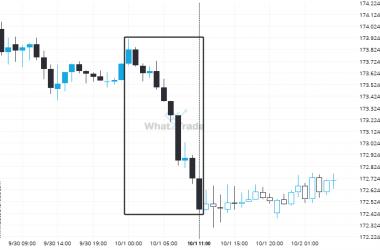
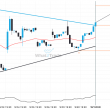
USD/JPY has broken through the resistance line of a Inverse Head and Shoulders technical chart pattern. Because we have seen it retrace from this line in the past, one should wait for confirmation of the breakout before taking any action. It has touched this line twice in the last 7 days and suggests a possible target level to be around 150.7163 within the next 22 hours.
USD/JPY through 150.47081395348837. Is this a confirming a breakout? Will it continue its path in the current trend toward 150.7163?