
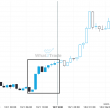
USD/JPY has broken through the support line of a Channel Up technical chart pattern. Because we have seen it retrace from this line in the past, one should wait for confirmation of the breakout before taking any action. It has touched this line twice in the last 24 days and suggests a possible target level to be around 114.5344 within the next 6 days.

ARTÍCULOS RELACIONADOS
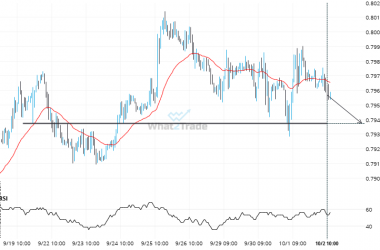
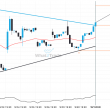
If you’re long USDCHF you should be aware of the rapidly approaching level of 0.7937
USDCHF is about to retest a key horizontal support level near 0.7937. It has tested this level 5…
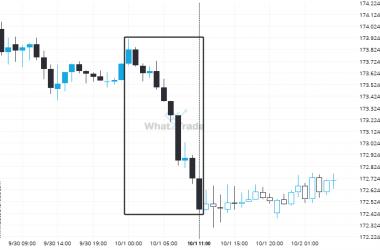
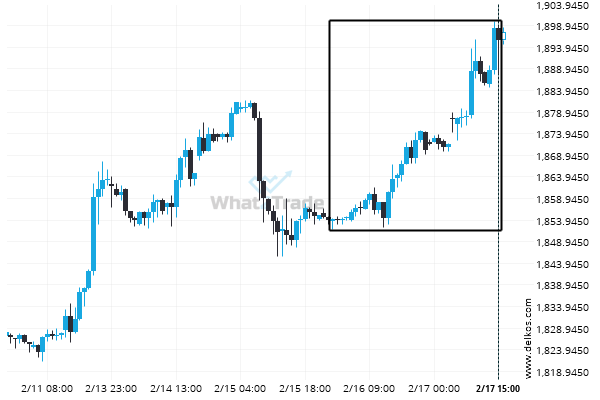
EURJPY – Large moves like this tend to draw attention.
EURJPY reached 172.4555 after a 0.79% move spanning 11 hours.
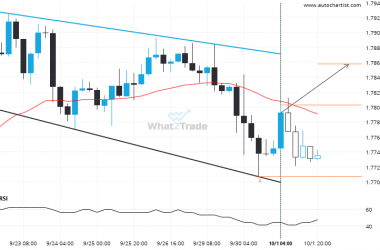
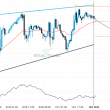
EURAUD is quickly approaching the resistance line of a Channel Down. We expect either a breakout through this line or a rebound.
EURAUD was identified at around 1.780935 having recently rebounded of the support on the 4 hour data interval.…