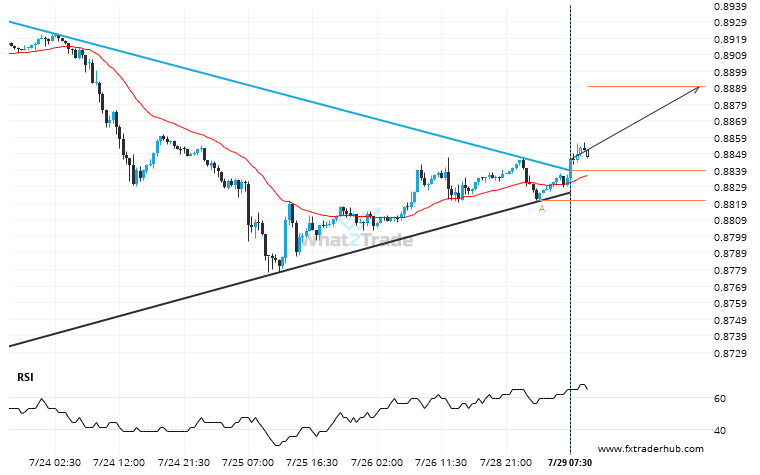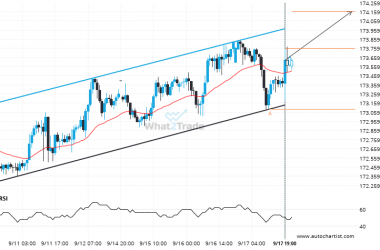
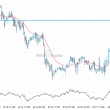
USD/CHF has broken through a resistance line of a Triangle and suggests a possible movement to 0.8890 within the next 23 hours. It has tested this line in the past, so one should probably wait for a confirmation of this breakout before taking action. If the breakout doesn’t confirm, we could see a retracement back to lines seen in the last 10 days.
USD/CHF through 0.8839001449275362. Is this a confirming a breakout? Will it continue its path in the current trend toward 0.8890?