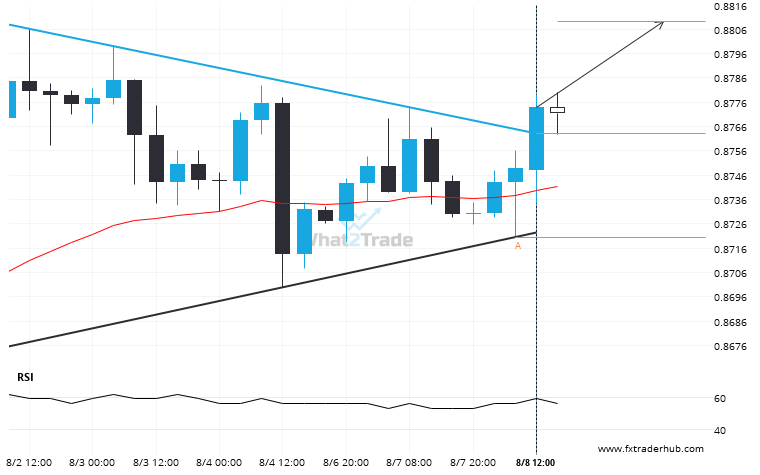
USD/CHF has broken through a resistance line. It has touched this line at least twice in the last 9 days. This breakout may indicate a potential move to 0.8809 within the next 2 days. Because we have seen it retrace from this position in the past, one should wait for confirmation of the breakout before trading.
ARTÍCULOS RELACIONADOS
Important resistance line being approached by EURCAD. This price has been tested numerous time in the last 12 days
The movement of EURCAD towards the resistance line of a Rising Wedge is yet another test of the…
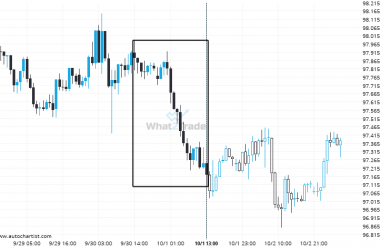
AUDJPY – Large moves like this tend to draw attention.
AUDJPY reached 97.175 after a 0.72% move spanning 23 hours.
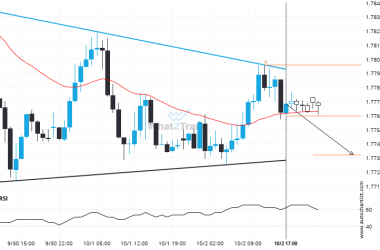
EURAUD is quickly approaching the support line of a Triangle. We expect either a breakout through this line or a rebound.
Emerging Triangle pattern in its final wave was identified on the EURAUD 1 hour chart. After a strong…


