
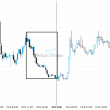
USD/CHF has broken through the resistance line of a Falling Wedge technical chart pattern. Because we have seen it retrace from this line in the past, one should wait for confirmation of the breakout before taking any action. It has touched this line twice in the last 26 days and suggests a possible target level to be around 0.9318 within the next 6 days.
ARTÍCULOS RELACIONADOS
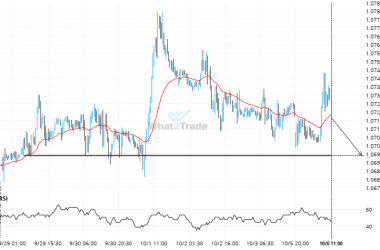
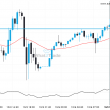
GBPCHF likely to test 1.0694 in the near future. Where to next?
GBPCHF is heading towards 1.0694 and could reach this point within the next 2 days. It has tested…
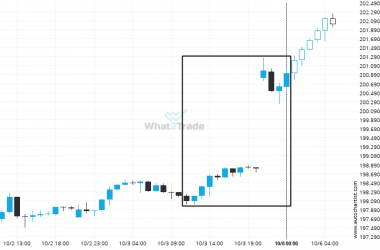
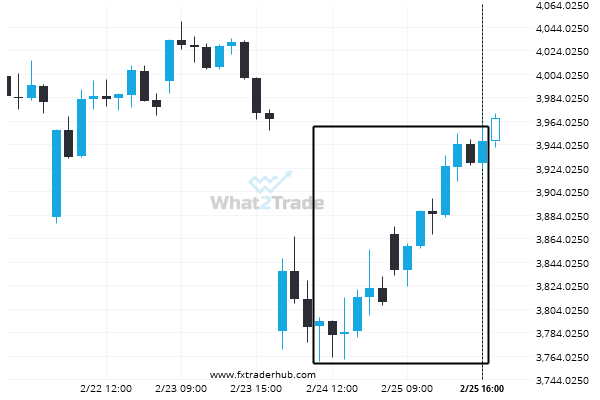
GBPJPY experienced a 1.44% bullish move in just 3 days. The magnitude speaks for itself.
GBPJPY just posted a 1.44% move over the past 3 days – a move that won’t go unnoticed…
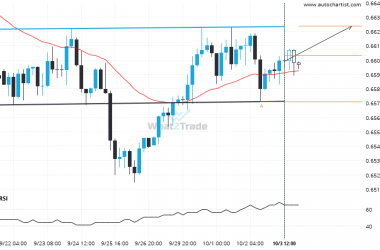
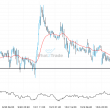
A possible move on AUDUSD as it heads towards resistance
AUDUSD is heading towards the resistance line of a Inverse Head and Shoulders and could reach this point…