Receive the latest alerts via email

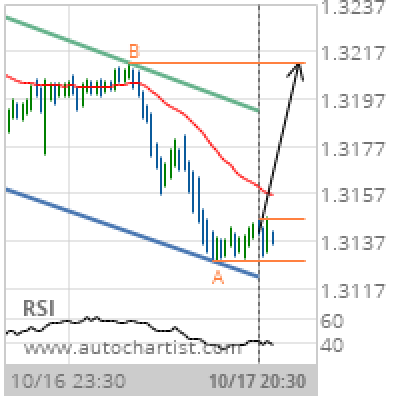
USD/CAD Target Level: 1.3212

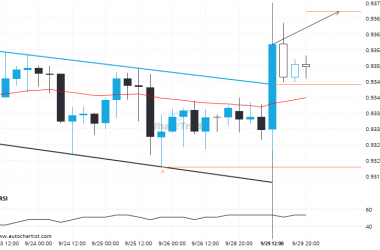
Channel Down identified at 17-Oct-2019 20:30 UTC. This pattern is still in the process of forming. Possible bullish price movement towards the resistance 1.3212 within the next 14 hours. Supported by RSI below 40 Chart 30 MinutesPattern Channel DownLength 93 CandlesIdentified 17-Oct-2019 20:30 UTC
USD/CAD Target Level: 1.3212

Channel Down identified at 17-Oct-2019 20:30 UTC. This pattern is still in the process of forming. Possible bullish price movement towards the resistance 1.3212 within the next 14 hours. Supported by RSI below 40

Chart 30 Minutes
Pattern Channel Down
Length 93 Candles
Identified 17-Oct-2019 20:30 UTC

Total
0
Shares
Previous Post

Breach of resistance could mean a start of a bullish trend on FRA40

Next Post

Important price line being approached by LTCBTC. This price has been tested numerous times before.

ARTÍCULOS RELACIONADOS