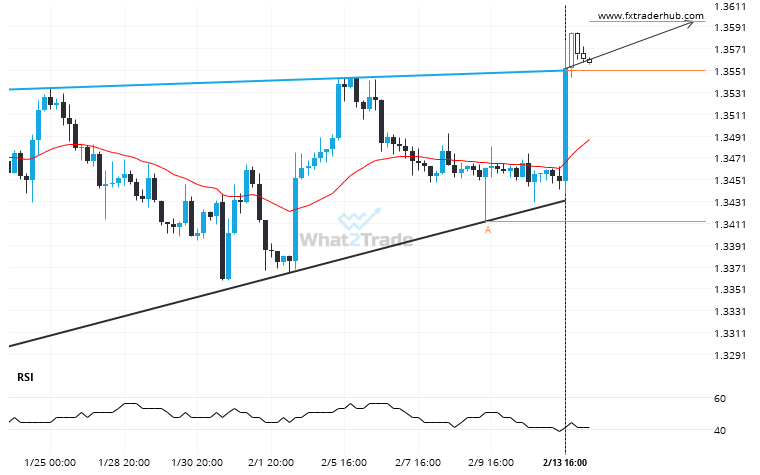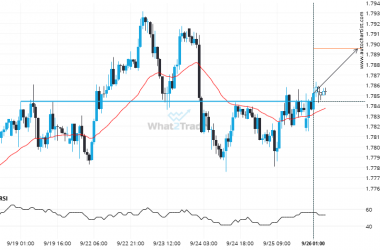
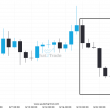
USD/CAD has broken through a resistance line of a Ascending Triangle and suggests a possible movement to 1.3596 within the next 4 days. It has tested this line in the past, so one should probably wait for a confirmation of this breakout before taking action. If the breakout doesn’t confirm, we could see a retracement back to lines seen in the last 23 days.
USD/CAD breakout from a Ascending Triangle trade setup. Will it continue this trend to hit the target price?