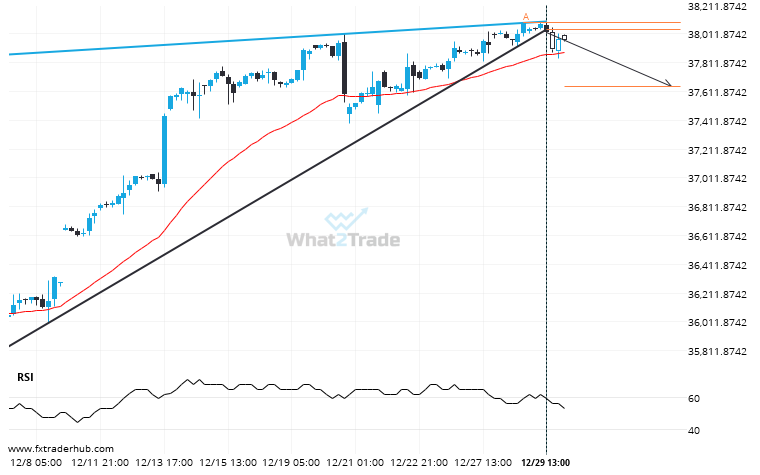
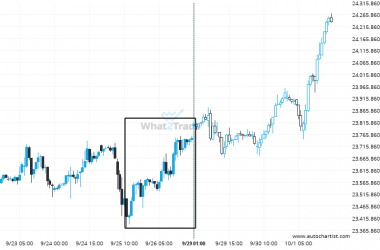
US30 moved through the support line of a Rising Wedge at 38043.456790123455 on the 4 hour chart. This line has been tested a number of times in the past and this breakout could mean an upcoming change from the current trend. It may continue in its current direction toward 37646.5847.
ARTÍCULOS RELACIONADOS
After testing 42973.0000 numerous times, Nikkei 225 is once again approaching this price point. Can we expect a bullish trend to follow?
Nikkei 225 is moving towards a key resistance level at 42973.0000. This is a previously tested level for…
Important resistance line being approached by FTSE 100. This price has been tested numerous time in the last 8 days
FTSE 100 is heading towards the resistance line of a Rising Wedge. If this movement continues, the price…
NAS 100 is approaching a resistance line of a Triangle. It has touched this line numerous times in the last 3 days.
Emerging Triangle detected on NAS 100 – the pattern is an emerging one and has not yet broken…