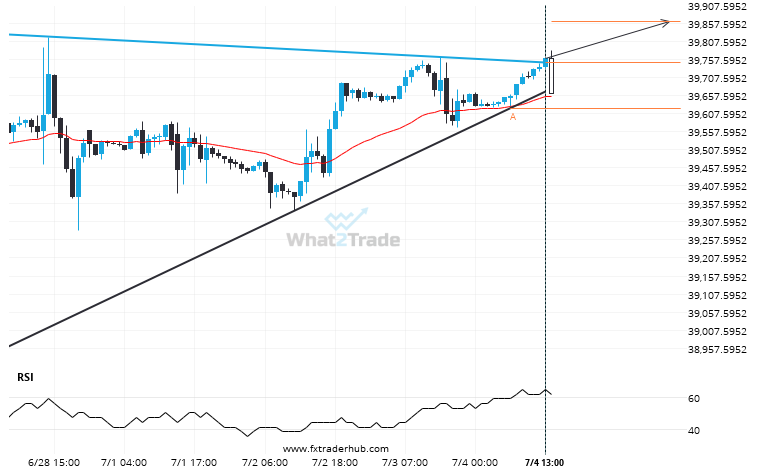
US30 moved through the resistance line of a Triangle at 39747.95522388059 on the 1 hour chart. This line has been tested a number of times in the past and this breakout could mean an upcoming change from the current trend. It may continue in its current direction toward 39862.5617.
ARTÍCULOS RELACIONADOS
Is the extremely large movement on DOW 30 a sign of things to come?
DOW 30 hits 40260.1 after a 8.95% move spanning 11 days.
Because NAS 100 formed a Channel Down pattern, we expect it to touch the resistance line. If it breaks through resistance it may move much higher
Emerging Channel Down detected on NAS 100 – the pattern is an emerging one and has not yet…
Supports and resistances are primary concepts of technical analysis. US 500 is heading for an important price of 5516.8198 – read about what this could mean for the future.
US 500 is moving towards a line of 5516.8198 which it has tested numerous times in the past.…