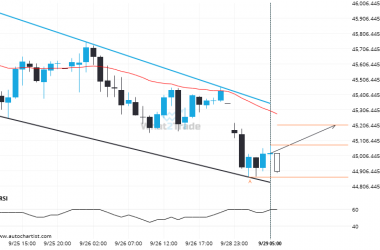
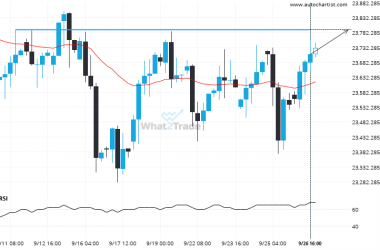
US30 has broken through the support line of a Channel Up technical chart pattern. Because we have seen it retrace from this position in the past, one should wait for confirmation of the breakout before trading. It has touched this line twice in the last 12 days and suggests a target line to be around 28572.9941 within the next 3 days.
ARTÍCULOS RELACIONADOS
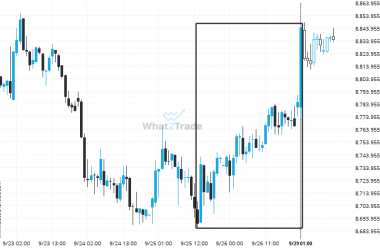
ASX 200 experienced a 1.78% bullish move in just 4 days. The magnitude speaks for itself.
ASX 200 has moved higher by 1.78% from 8689.4 to 8844.2 in the last 4 days.
A possible move on Nikkei 225 as it heads towards resistance
Emerging Channel Down pattern in its final wave was identified on the Nikkei 225 1 hour chart. After…
DAX 40 heading towards a price it has tested 4 times in the recent past.
DAX 40 is approaching a resistance line at 23791.3008. If it hits the resistance line, it may break…

