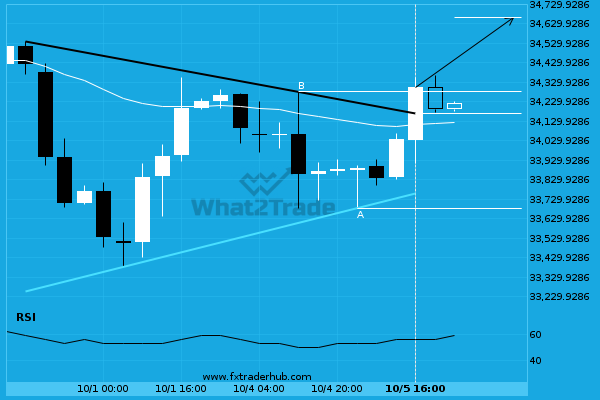
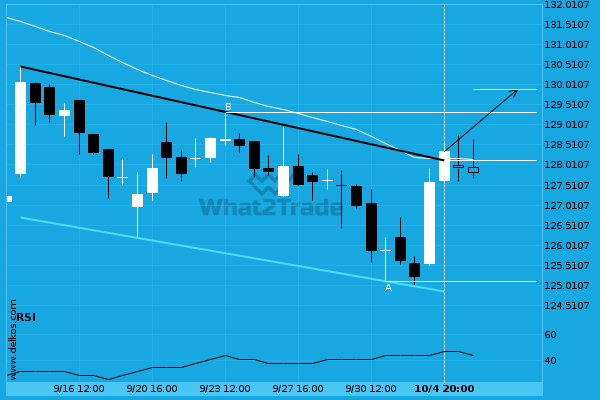
US30 has broken through the resistance line of a Triangle technical chart pattern. Because we have seen it retrace from this position in the past, one should wait for confirmation of the breakout before trading. It has touched this line twice in the last 6 days and suggests a target line to be around 34659.8169 within the next 18 hours.
ARTÍCULOS RELACIONADOS
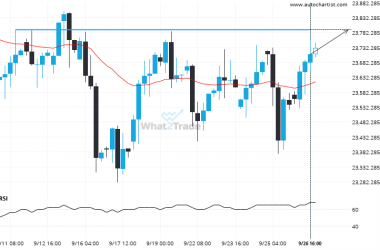
DAX 40 heading towards a price it has tested 4 times in the recent past.
DAX 40 is approaching a resistance line at 23791.3008. If it hits the resistance line, it may break…
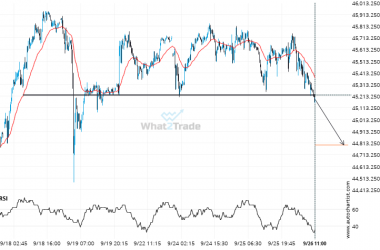
Nikkei 225 may be on a start of a new bearish trend after its breakout through this important support level
Nikkei 225 is once again retesting a key horizontal support level at 45225.0000. It has tested this level…
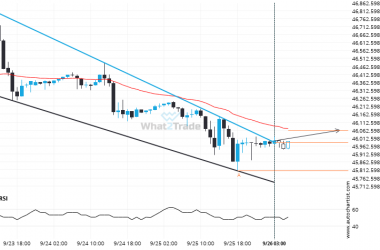
DOW 30 has broken through resistance of a Falling Wedge. It has touched this line at least twice in the last 3 days.
The breakout of DOW 30 through the resistance line of a Falling Wedge could be a sign of…

