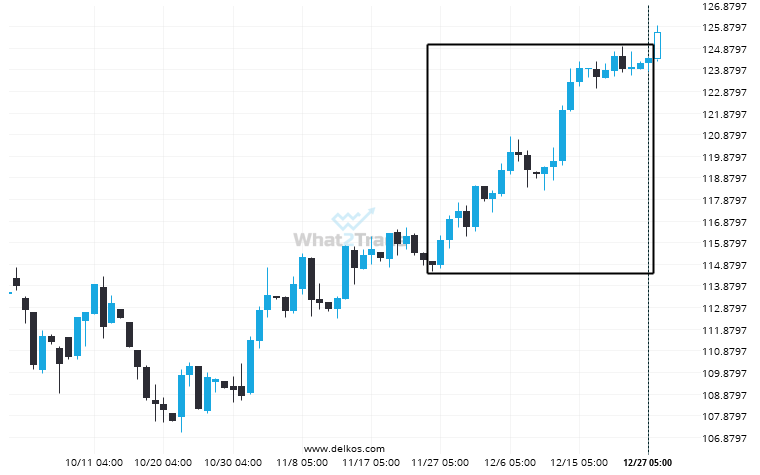
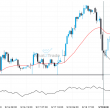
An unexpected large move has occurred on Us Treasury Bond March 2024 Daily chart beginning at 114.84375 and ending at 124.40625. Is this a sign of something new? What can we expect in the future?
ARTÍCULOS RELACIONADOS
A possible move by US Oil towards 66.0405
The last 6 30 Minutes candles on US Oil formed a Head and Shoulders pattern and broken out…
Breach of 3.3335 could mean a start of a bearish trend on Natural Gas
Natural Gas has broken through a support line. It has touched this line numerous times in the last…
Silver Spot consistently settling in one direction. Will it continue?
Due to the rate of consecutive bullish candles on Silver Spot Daily chart we could be in for…