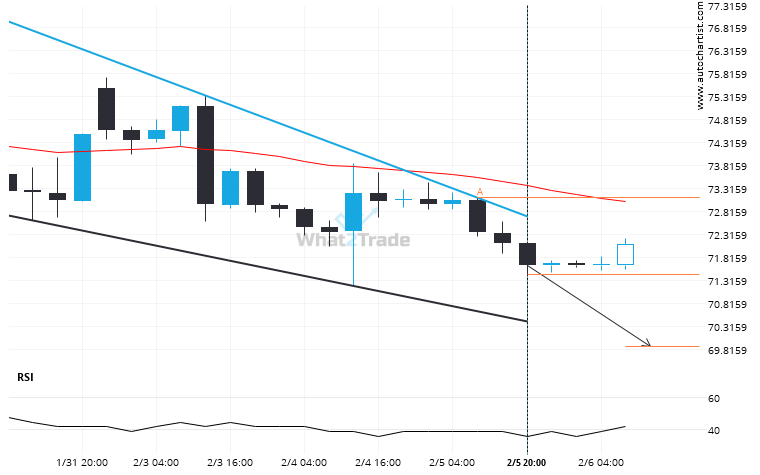
An emerging Falling Wedge has been detected on US Oil on the 4 hour chart. There is a possible move towards 69.8772 next few candles. Once reaching resistance it may continue its bearish run or reverse back to current price levels.
ARTÍCULOS RELACIONADOS
Gold Spot experienced a very large 48 days bullish move to 3909.648.
Gold Spot reached 3909.648 after a 16.81% move spanning 48 days.
Brent Crude through 65.85670422535212. Is this a confirming a breakout? Will it continue its path in the current trend toward 67.7624?
Triangle pattern identified on Brent Crude has broken through a resistance level with the price momentum continuing to…
Will US Oil break through the resistance level it tested before?
US Oil is moving towards a key resistance level at 62.0110. This is a previously tested level for…