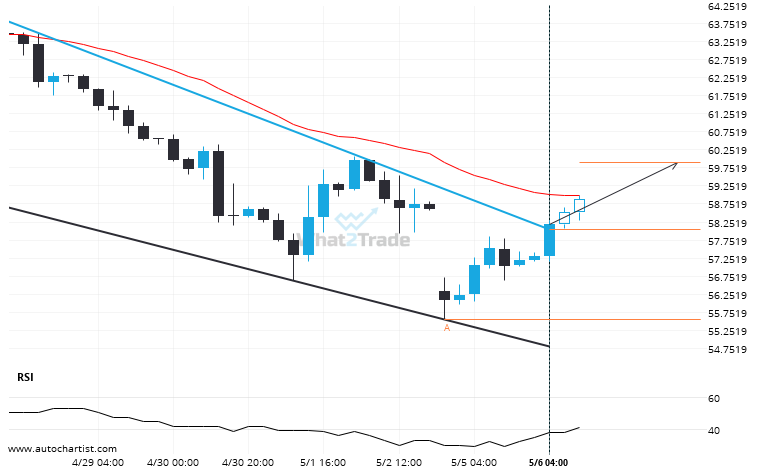
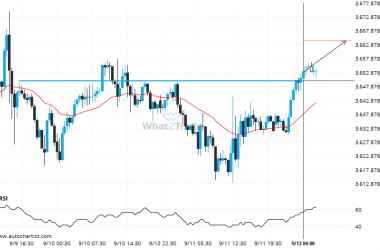
US Oil moved through the resistance line of a Channel Down at 58.05049999999999 on the 4 hour chart. This line has been tested a number of times in the past and this breakout could mean an upcoming change from the current trend. It may continue in its current direction toward 59.8855.
US Oil broke through a resistance at 2025-05-06T02:00:00.000Z, with the price momentum continuing to move in an upward direction over the next hours, good opportunity presents itself with the price expected to reach 59.8855.