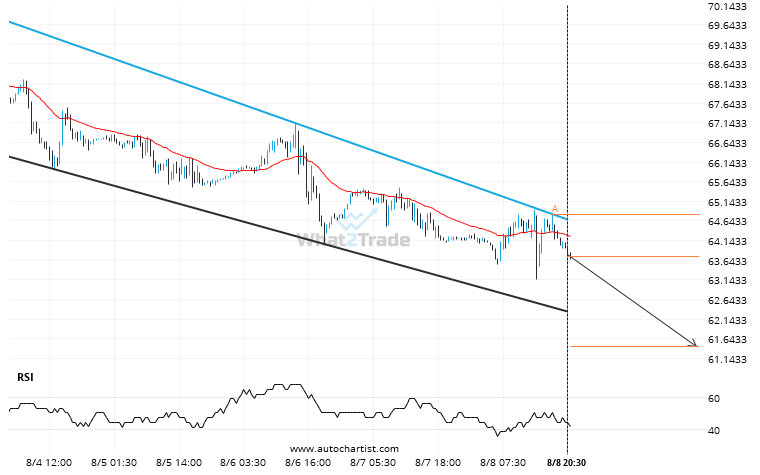
US Oil was identified at around 63.741 having recently rebounded of the resistance on the 30 Minutes data interval. Ultimately, the price action of the stock has formed a Channel Down pattern. This squeeze may increases the chances of a strong breakout. The projected movement will potentially take the price to around the 61.4376 level.
ARTÍCULOS RELACIONADOS
US Oil keeps moving closer towards 64.8865. Will it finally breach this level?
US Oil is approaching a resistance line at 64.8865. If it hits the resistance line, it may break…
Important support line being approached by US Oil. This price has been tested numerous time in the last 12 days
US Oil is moving towards a support line which it has tested numerous times in the past. We…
Natural Gas formed a Ascending Triangle on the 15 Minutes chart. Retest of resistance in sight.
Emerging Ascending Triangle detected on Natural Gas – the pattern is an emerging one and has not yet…