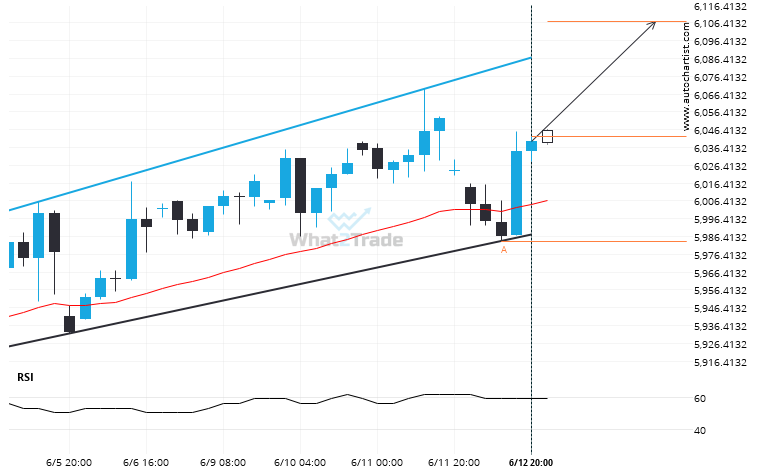
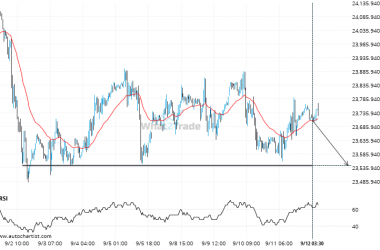
US 500 is moving towards a resistance line which it has tested numerous times in the past. We have seen it retrace from this line before, so at this stage it isn’t clear whether it will breach this line or rebound as it did before. If US 500 continues in its current trajectory, we could see it reach 6107.2720 within the next 2 days.
ARTÍCULOS RELACIONADOS
Will Nikkei 225 break through the resistance level it tested before?
Nikkei 225 is heading towards a line of 43494.0000. If this movement continues, the price of Nikkei 225…
NAS 100 is signaling a possible trend reversal on the intraday charts with price not breaching support.
Emerging Channel Up pattern in its final wave was identified on the NAS 100 4 hour chart. After…
After trying numerous times in the past, FTSE 100 finally breaks 9165.2197!
FTSE 100 has breached the resistance line at 9165.2197. It may continue the bullish trend towards 9220.1670, or,…