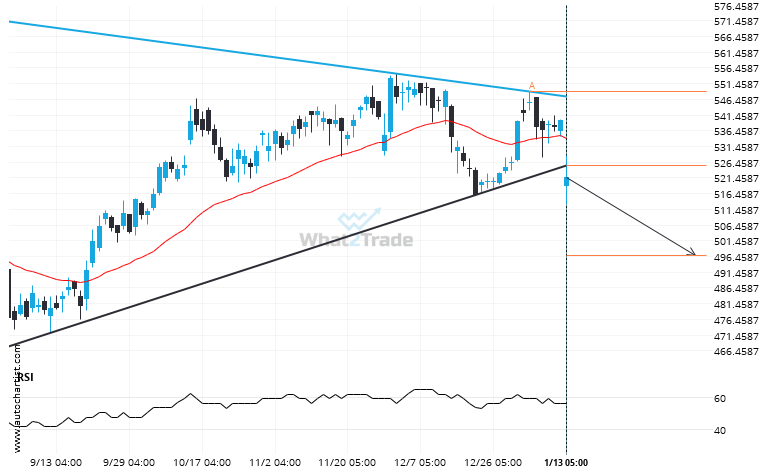
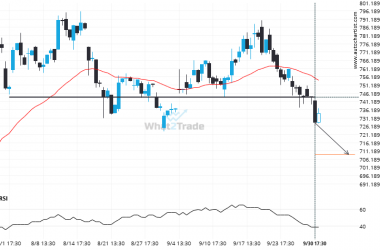
UnitedHealth Group Incorporated moved through the support line of a Triangle at 525.245 on the Daily chart. This line has been tested a number of times in the past and this breakout could mean an upcoming change from the current trend. It may continue in its current direction toward 496.88.
ARTÍCULOS RELACIONADOS
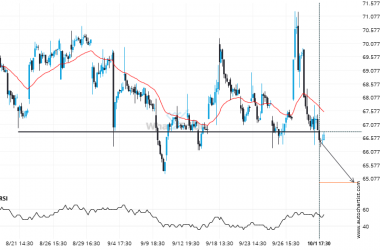
If you’re long PYPL you should be aware that 66.7950 has just been breached – a level tested 6 time in the past
PYPL has broken through a support line. Because we have seen it retrace from this price in the…
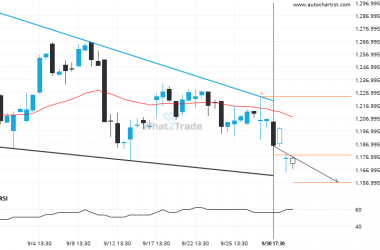
NFLX – approaching a support line that has been previously tested at least twice in the past
A Falling Wedge pattern was identified on NFLX at 1178.335, creating an expectation that it may move to…
After testing 743.9550 numerous times, META has finally broken through. Can we expect a bearish trend to follow?
META has breached the support line at 743.9550. It may continue the bearish trend towards 708.9245, or, it…

