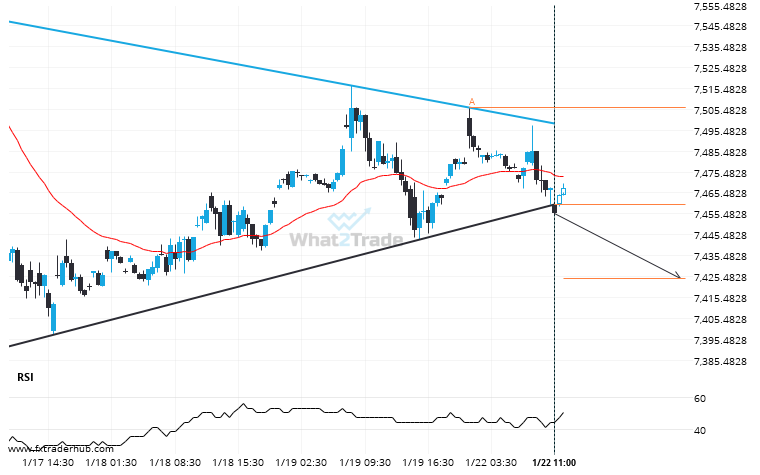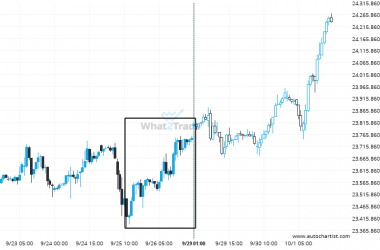
UK100 has broken through a support line of a Triangle chart pattern. If this breakout holds true, we may see the price of UK100 testing 7424.7583 within the next 17 hours. But don’t be so quick to trade, it has tested this line in the past, so you should confirm the breakout before taking any action.
UK100 has broken through support of a Triangle. It has touched this line at least twice in the last 6 days.