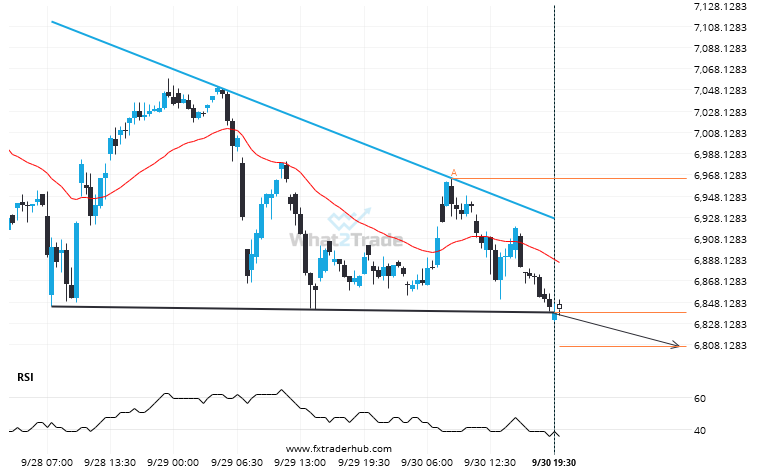
UK100 has broken through a support line. It has touched this line at least twice in the last 3 days. This breakout may indicate a potential move to 6806.1884 within the next 16 hours. Because we have seen it retrace from this position in the past, one should wait for confirmation of the breakout before trading.
ARTÍCULOS RELACIONADOS
FTSE 100 is signaling a possible trend reversal on the intraday charts with price not breaching resistance.
An emerging Channel Up has been detected on FTSE 100 on the 4 hour chart. There is a…
After testing 44490.4492 numerous times, DOW 30 has finally broken through. Can we expect a bearish trend to follow?
DOW 30 has broken through 44490.4492 which it has tested numerous times in the past. We have seen…
US 500 has broken through resistance of a Triangle. It has touched this line at least twice in the last 6 days.
US 500 has broken through a resistance line of a Triangle chart pattern. If this breakout holds true,…