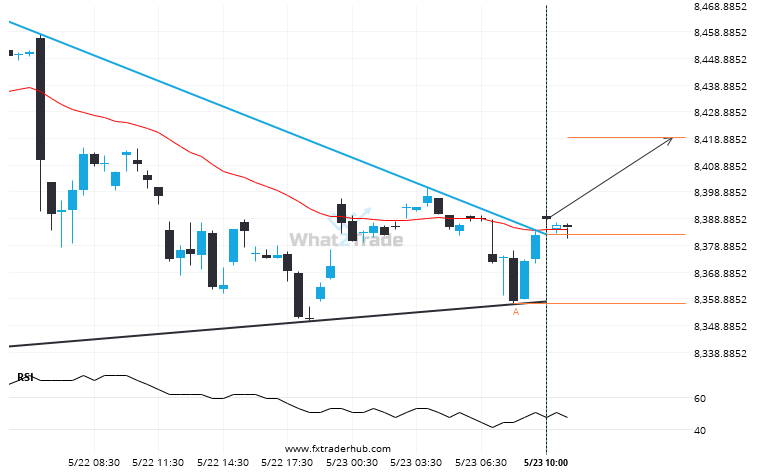
This trade setup on UK100 is formed by a period of consolidation; a period in which the price primarily moves sideways before choosing a new direction for the longer term. Because of the bullish breakout through resistance, it seems to suggest that we could see the next price move to 8419.2945.
ARTÍCULOS RELACIONADOS
Important resistance line being approached by FTSE 100. This price has been tested numerous time in the last 20 days
An emerging Rising Wedge has been detected on FTSE 100 on the 1 hour chart. There is a…
Rare bullish streak on the ASX 200 Daily chart.
ASX 200 posted a high rate of consecutive bullish candles on the Daily chart.
After testing 7892.2002 numerous times, CAC 40 has finally broken through. Can we expect a bullish trend to follow?
CAC 40 has broken through 7892.2002 which it has tested numerous times in the past. We have seen…